Authored by Lance Roberts via RealInvestmentAdvice.com,
After more than three decades of watching oil markets upend economies, one pattern keeps repeating: investors learn the wrong lessons from the last shock. The 1973 OPEC embargo taught us that geopolitical disruptions are temporary. That lesson then got everyone killed, financially speaking, in 1979. The 2003 Iraq War produced only a mild oil bump and no recession, so traders got comfortable. Then 2008 happened. Today, with Brent crude having spiked over 60% since U.S. and Israeli strikes on Iran began in late February, the same dangerous reasoning is circulating again. That narrative is that this “event” is manageable and will resolve quickly. If that is the case, then the economy will absorb it.
That may indeed be the case. However, the conditions that determine whether an oil shock becomes a full recession are specific, quantifiable, and worth examining with clear eyes. That is what this analysis does.

Not All Oil Shocks Are The Same
The post-World War II era has produced a half-dozen oil price crises significant enough to reshape the global economy. They share a surface-level similarity: prices spike, headlines scream, and politicians rage. However, beyond those commonalities, they diverge dramatically in their underlying causes and economic consequences. (Read Energy Price as an Economic Indicator)
The 1973 OPEC Embargo stands alone as the archetype. OAPEC nations cut production and placed a deliberate embargo on the United States in response to U.S. support for Israel during the Yom Kippur War. In roughly 4 months, the price of crude oil rose from $3 per barrel to nearly $12 globally, a 300% surge. The U.S. economy, already running hot with inflation at 3.4%, could not absorb the blow. GDP contracted 0.5% in 1974. Unemployment climbed from 4.6% to 9% by May 1975. The Fed raised its benchmark rate from 5.75% in 1972 to 12% by 1974 and still could not contain prices. The result was stagflation: high inflation (above 9%), high unemployment, and slow economic growth. Those THREE factors are the ugliest combination in economics.
Note: That last sentence is crucially important. Headlines are currently filled with the term “stagflation.” As discussed in the linked article above, current economic data does not meet the definition of stagflation.
The 1979 Iranian Revolution delivered a second shock to an economy still bruised from the first. Iran’s oil exports, then running at roughly 5 million barrels per day, collapsed as internal chaos overtook the country. Unlike the 1973 embargo, this was not a deliberate strategy; it was a production collapse driven by revolution. The oil supply only dropped about 4% globally, but the market’s reaction doubled crude prices to nearly $40 per barrel within 12 months. The Iran-Iraq War, which began in 1980, compounded the disruption. The U.S. entered another recession. Fed Chairman Paul Volcker ultimately had to drive interest rates to 20% to break the inflation spiral.
The 1990 Gulf War shock was sharper but shorter. Iraq’s invasion of Kuwait removed roughly 4.3 million barrels per day from the market. Oil went from $15 to $42 per barrel in two months, a 75% spike. The U.S. entered a mild recession, with the S&P 500 falling about 21% from its peak. Crucially, the disruption lasted only months. Once coalition forces pushed Iraq back and Kuwaiti fields resumed production, prices fell sharply, and the economic damage was contained. This episode is the key comparative reference point for why duration matters so much.
The 2007-2008 oil surge is more complex. Prices rose nearly 100%, from roughly $50 to a peak of $147 per barrel in July 2008. The cause was not primarily a supply disruption; it was demand-driven, driven by a decade of explosive growth in China and by hoarding commodities in an unprecedented manner. But the shock landed on an economy already fracturing from the housing and credit collapse. The S&P 500 would go on to lose 55% from peak to trough. Attributing that devastation primarily to oil prices misreads the episode. The financial system’s breakdown amplified every other economic stress factor.
The Russia-Ukraine oil shock of 2022 drove Brent crude to $139 per barrel by March before falling back. The U.S. never officially entered a recession by the traditional two-quarter GDP definition, though it suffered a significant corrective event. The key difference was that the U.S. had by then become a net exporter of petroleum products, blunting the direct impact of prior shocks. However, the Fed was aggressively hiking interest rates to combat the surge in inflation resulting from the Pandemic-driven stimulus.

So, what does this mean?
What Separates The Killers From The Scares
The Federal Reserve Board’s own researchers concluded that there is no mechanical link between net oil price increases and subsequent recessions, even controlling for the magnitude of the spike. That statement sounds almost reassuring; however, what it actually means is more sobering. The same oil shock that causes a deep recession in one environment may barely register in another. The conditions surrounding the shock determine the outcome.
Five variables differentiate the recession-inducing shocks from the ones that economies absorbed:
-
Duration and persistence of the disruption. The 1973 embargo lasted six months. The Iranian Revolution removed Iranian supply for much of 1979, then extended it by the Iran-Iraq War into the 1980s. These were multi-year disruptions that forced structural change, manufacturers to reprice inputs, households to slash consumption, and central banks to make crisis decisions in real time. The 1990 Gulf War spike lasted two months before Kuwait came back online. The economy absorbed a body blow, but not a sustained one. The difference between a broken rib and a severed artery is time and severity.
-
Inflation conditions before the shock. The 1973 and 1979 shocks both hit economies where inflation was already elevated, and inflation expectations were untethered. The St. Louis Fed’s research found that the average real energy price increase preceding the four recessions between 1973 and 1991 was 17.5%, and in each case, the shock compounded pre-existing inflation dynamics. When workers expect prices to keep rising, they demand higher wages. When companies expect input costs to keep rising, they raise prices pre-emptively. The wage-price spiral becomes self-reinforcing. The 2004 to 2005 oil price increase was actually larger than the one that preceded the 2007 to 2009 recession, yet it did not trigger a recession. The difference was that inflation expectations were anchored in the mid-2000s, unlike in the 1970s.
-
The role of monetary policy and its timing. Paul Volcker’s decision to raise rates to 20% was the necessary kill shot on 1970s stagflation, but it also pushed the economy into a severe 1981 to 1982 recession. The Fed’s response to an oil shock matters as much as the shock itself. An accommodative Fed that lets oil-driven inflation embed in the broader economy risks a worse outcome. A hawkish Fed that overreacts to supply-side inflation can trigger a recession independent of the oil shock itself. Neither 2003 nor 2010 saw the Fed forced into a crisis tightening cycle specifically because of oil.
-
Energy intensity of the economy. This is the most structurally important factor for the current period. The amount of oil required to produce one unit of U.S. GDP has declined by more than 70 percent since the 1970s, according to World Bank data. As Paul Krugman noted in a recent analysis, the U.S. economy has roughly tripled in size since the late 1970s while consuming approximately the same total volume of oil. Every dollar of GDP today requires dramatically less energy than it did in 1973. As the IMF estimated, a sustained 30% increase in oil prices would reduce global GDP by up to 0.5%, which is serious but not catastrophic. The same shock in 1973 could cause damage multiple times that amount.
-
U.S. net energy position. In 1973, the United States imported nearly everything it consumed. Today, the U.S. runs a net petroleum trade surplus — $58 billion in 2025, per Census Bureau data. Higher oil prices are a direct tax on importers. They’re a revenue windfall for exporters. The U.S. is now partially both, which fundamentally changes the calculus. Energy companies and the states where they operate benefit from price spikes even as consumers are hurt. That offset did not exist in any meaningful way before the shale revolution.

The 2026 Oil Shock – How Does It Compare?
On February 28, 2026, the United States and Israel launched coordinated strikes on Iran targeting leadership, security forces, and missile infrastructure. Within days, Iran retaliated with missile strikes targeting oil vessels and infrastructure throughout the Gulf region. The Strait of Hormuz, through which roughly 20 million barrels per day of crude oil and refined products normally flow, representing about 20% of global seaborne oil trade, effectively closed to normal traffic. Such headlines generally provide a springboard for more catastrophic views.

Those actions caused Brent crude to surge from around $70 per barrel before the conflict to $113.52 as of March 23. That is a 60-plus percent spike in under four weeks. In nominal terms, this is approaching the 2008 peak of $147 per barrel. The IEA’s 32 member nations coordinated the largest emergency drawdown of strategic reserves in the agency’s 52-year history, releasing 400 million barrels, more than double the volume deployed after the Russia-Ukraine outbreak in 2022.

So is this time different? In some ways, yes — and in ways that cut both directions.
The structural arguments for a more muted impact are real.
-
The U.S. oil intensity of GDP has fallen roughly 70% since 1973.
-
The U.S. is a net petroleum exporter.
-
The strategic reserve architecture now exists specifically for scenarios like this.
-
And inflation expectations, while elevated, are nowhere near the unanchored levels of the late 1970s.
Given this backdrop, Oxford Economics modeling suggests that global oil prices would need to average $140 per barrel for two months, alongside significant financial market tightening and deteriorating consumer confidence, to pose a clear recessionary risk.
On the other hand, the arguments for this being a more dangerous shock are equally serious. The Strait of Hormuz presents a physical chokepoint that cannot be bypassed through rerouting or sanctions workarounds, the way Russian supply was redirected after 2022. Roughly 80% of Asia’s oil imports transit that strait. Vietnam holds fewer than 20 days of reserve supply. The European Central Bank has already postponed planned rate cuts, raised its 2026 inflation forecast, and warned of the risk of stagflation for energy-intensive economies. Germany, the UK, and Italy face the highest recession exposure in Europe. And the U.S. economy entered this shock with a soft labor market, elevated consumer debt, declining consumer sentiment, and a stock market trading at historically expensive valuations before the conflict began.
Capital Economics recently projected that even in a contained three-month conflict scenario, Brent could average $150 per barrel over the next six months. In such a prolonged scenario, the IMF Managing Director warned of a meaningful global inflationary impact. Morgan Stanley also flagged that a conflict lasting longer than a few weeks would meaningfully raise recession probabilities through multiple channels: energy costs, inflation persistence, and tightening financial conditions.
This shock is bigger in scope than 1990, comparable in speed to 1973, structurally more like the physical supply shock of 1979 than the demand-driven surge of 2007, and occurring in an economy that is better insulated in some ways but already stressed in others.

The honest answer is that the outcome is genuinely uncertain and a situation that investors should not entirely ignore.
MARKET BEHAVIOR AND THE INVESTOR PLAYBOOK
History draws a sharp line between market outcomes in oil shocks that became recessions and those that did not. That line does not disappear just because it’s uncomfortable.
In the four oil-linked recessions between 1973 and 1991, the S&P 500 experienced average peak-to-trough declines of 20-48%. The 2007 to 2009 Great Recession, where elevated oil prices compounded financial system collapse, saw the index fall 55% from its highs. Recovery in these recession scenarios took anywhere from 126 trading days (post-COVID) to 895 trading days (post-Great Recession) to reclaim prior levels. That dispersion matters to any investor thinking about sequence-of-returns risk or near-term liquidity needs.
The non-recession oil shock episodes tell a different story. After the 2003 Iraq War oil spike, the S&P 500 delivered roughly 25% gains over the following year. Following the 2016 OPEC production cut cycle and resulting price rebound, equities posted approximately 19% returns in the subsequent 12 months. Kedia Advisory’s analysis of 7 oil spike episodes since 1986 found that the S&P 500 averaged a 24% return in the year following a major oil surge, with 6 of the 7 episodes producing positive forward returns. The one exception was 2008, when oil’s spike coincided with total financial system breakdown.
The critical investor lesson is that the oil shock itself rarely determines the market outcome. The recession does. And the recession typically follows when the shock is persistent, when it combines with pre-existing economic weakness, and when monetary policy cannot respond flexibly. That is precisely the risk matrix investors need to monitor right now.

What should investors do differently given this analysis? Three principles apply regardless of how the current conflict resolves.
-
Manage duration risk in fixed income carefully. If this shock persists and inflation re-accelerates, the Fed will face pressure to keep rates higher for longer. That means Treasuries with long maturities carry more risk than they appear. Short-duration Treasuries and I-bonds remain the cleaner defensive position.
-
Review energy exposure deliberately. Energy stocks historically outperform during sustained oil price shocks. The 2022 experience confirmed this as energy was the only S&P 500 sector to post positive returns for the year. But energy stocks often reverse sharply when the shock resolves, so this is a tactical, not a structural, position.
-
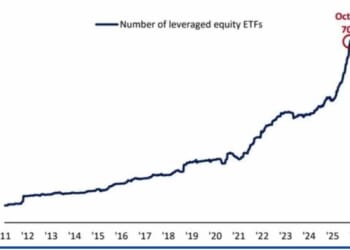
Most importantly, do not let the shock force reactive decisions. The S&P 500 is already down about 7% month-to-date as of late March. A further 10 to 15% correction would not be historically unusual, even in a non-recessionary oil-shock scenario. For investors with properly structured portfolios, that kind of volatility is noise. For investors concentrated in high-multiple, rate-sensitive growth stocks, it may be the beginning of a more serious repricing.
The data across 50 years of oil shocks says this: if it’s a scare, markets often recover quickly, and investors who sold regret it. If it’s the beginning of a recession, the damage compounds for months before the bottom is clear. The difference between those two outcomes is driven by factors that are still unfolding and questions that need to be answered.
-
How long will the Strait of Hormuz remain disrupted?
-
Will inflation expectations remain anchored or begin to drift higher?
-
And, most critically, will the Fed maintain its policy flexibility or lose it?
I’m watching all three closely, and so should you.