
Between June 10th and June 16th, 2025, the Manhattan Institute conducted a survey of 1,000 likely voters in New York City’s upcoming mayoral election, including an oversample of 644 Democratic primary voters to provide granular insights into primary dynamics. The sample was drawn from a national voter file and weighted to reflect the likely 2025 electorate on age, gender, race, county, education, party registration, and 2024 presidential vote. Responses were collected using a mixed-mode approach: online (400), SMS-to-web (420), live calls to cell phones (153), and landlines (27). The margin of error is ±3.1% for the likely voters sample and ±3.9% for the primary voters sample.
Despite the Big Apple’s progressive image, the mayoral electorate takes a markedly more skeptical view on crime, homelessness, and immigration than national narratives suggest. Assemblymember Zohran Mamdani has energized a vocal progressive flank, but their views on policing and public order are far afield from those of most New Yorkers. Former Governor Andrew Cuomo, by contrast, leads the Democratic primary and commands the broadest general election coalition—not because voters are nostalgic, but because they’re uneasy. The picture that emerges is not of a city in revolt, but of one seeking a course correction.
Full Results Available: Toplines (General Election Likely Voters), Toplines (Democratic Primary Likely Voters), Crosstabs (General Election Likely Voters), Crosstabs (Democratic Primary Likely Voters)
Tuesday’s Democratic Primary
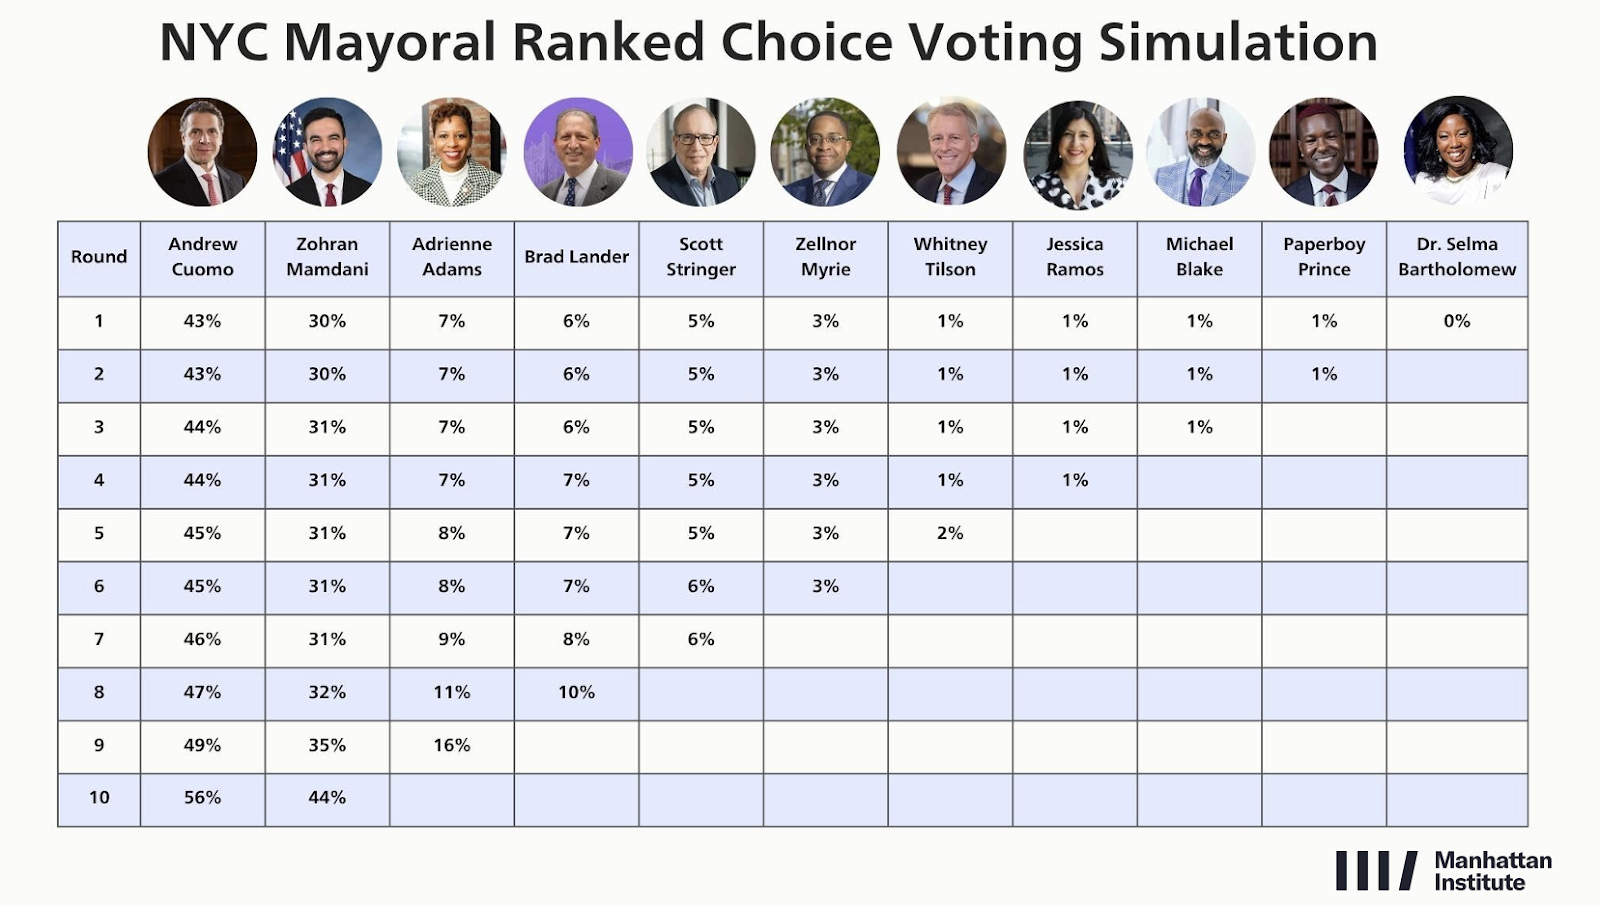
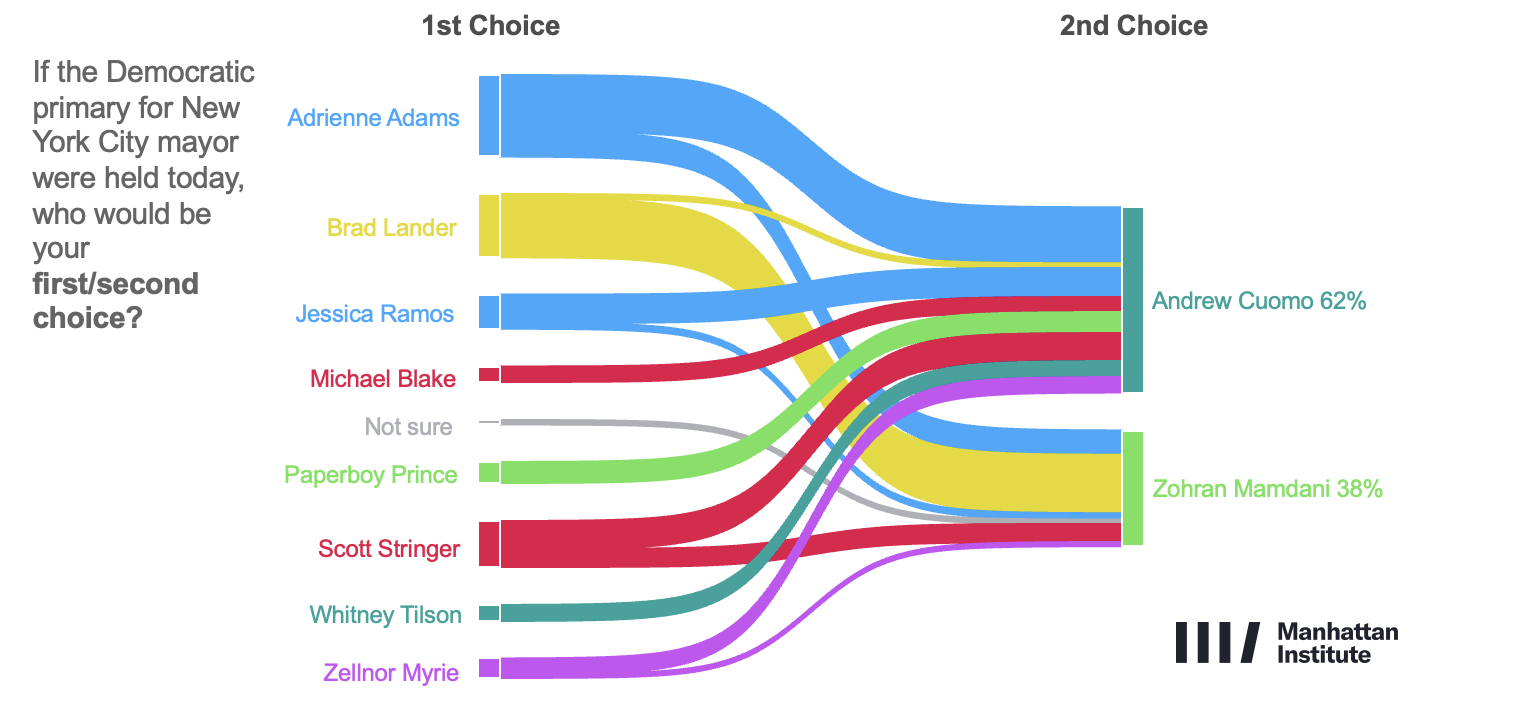
Our ranked-choice simulation (Figure 1) shows Cuomo defeating Mamdani 56% to 44% in the final round. The former governor opens with a 13-point lead in the first round (43% to 30%), with the remaining vote scattered across City Council Speaker Adrienne Adams, current Comptroller Brad Lander, former comptroller Scott Stringer, and others. Cuomo maintains his lead through every round and comes within striking distance of a majority in round 9 before sealing the win in round 10. The race remains fluid, but with one week to go and despite the media narrative of a Mamdani surge, Cuomo remains what he has been from the start: the frontrunner.
Figure 1
Five dynamics shape the race:
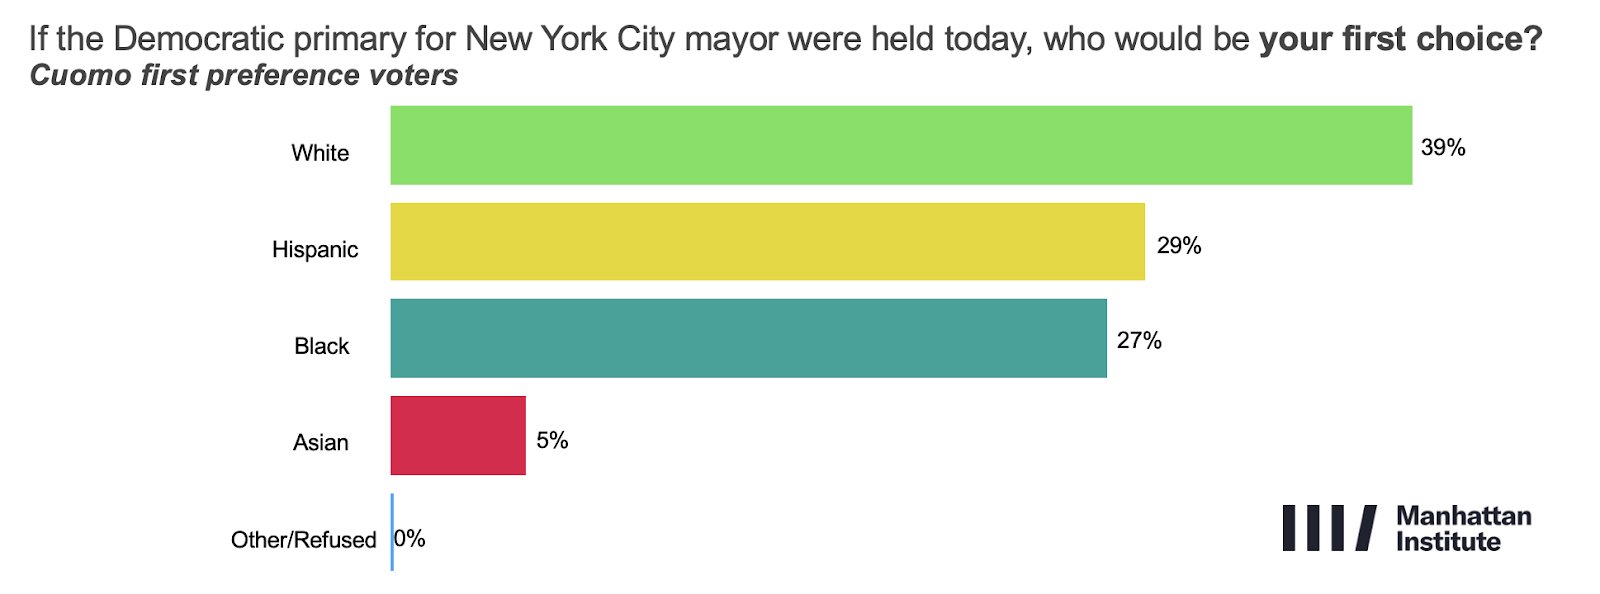
- Black voters are Cuomo’s firewall. He is the clear first choice among black Democratic primary voters (39%), with Zohran Mamdani a distant second (16%). Cuomo’s path to victory depends on strong black turnout (Figure 2).
Figure 2: More than half of Cuomo’s first-preference votes are from Hispanic and black voters
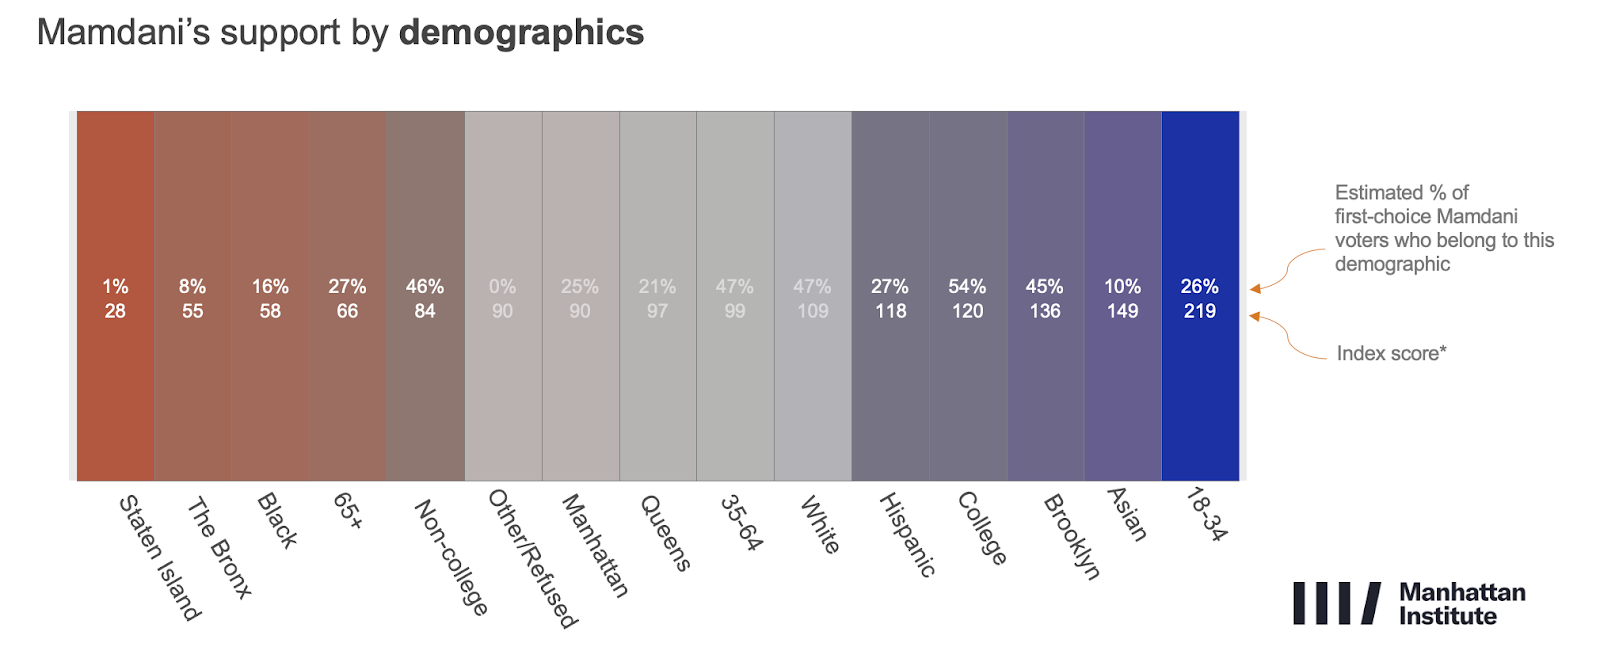
- Mamdani’s base is young, college-educated, and overwhelmingly progressive. Among 18–34-year-old college grads, 67% rank Mamdani first, compared to just 6% for Cuomo (Figure 3).
Figure 3: One in four of Mamdani’s support base comes from 18–34 year olds
- Issue priorities map cleanly onto candidate support. Among Cuomo first-choicers, 36% list crime/public safety as a top concern; among Mamdani supporters, just 5% say the same. Meanwhile, 59% of Mamdani voters cite housing costs as a top issue, compared to 20% of Cuomo’s. Voters who prioritize crime overwhelmingly break Cuomo’s way.
- Final-round consolidation could be the tipping point. Cuomo only clinches a majority after picking up Stringer and Lander voters in the final rounds, suggesting that endorsements from ideologically adjacent candidates may matter in the last days of the race (Figure 4).
- Youth turnout is the major wildcard. Mamdani wins 60% of first-choice votes from 18–34-year-olds citywide, compared to just 10% for Cuomo. If young voters turn out at significantly higher rates than in past primaries, the race could tighten. For example, if 18–34-year-olds make up 24% of the electorate—double their share in 2017 or 2021—the race becomes a statistical tie. If their share rises to 30%, Mamdani would likely edge out a narrow win over Cuomo.
Figure 4: Cuomo is the second-choice favorite for most candidates’ supporters—including a large share of Adrienne Adams voters—while Mamdani relies more heavily on support from progressive rivals like Lander
November’s General Election
We tested multiple general election matchups with various candidate configurations. Party labels were omitted due to lingering uncertainty around how each candidate will appear on the November ballot.
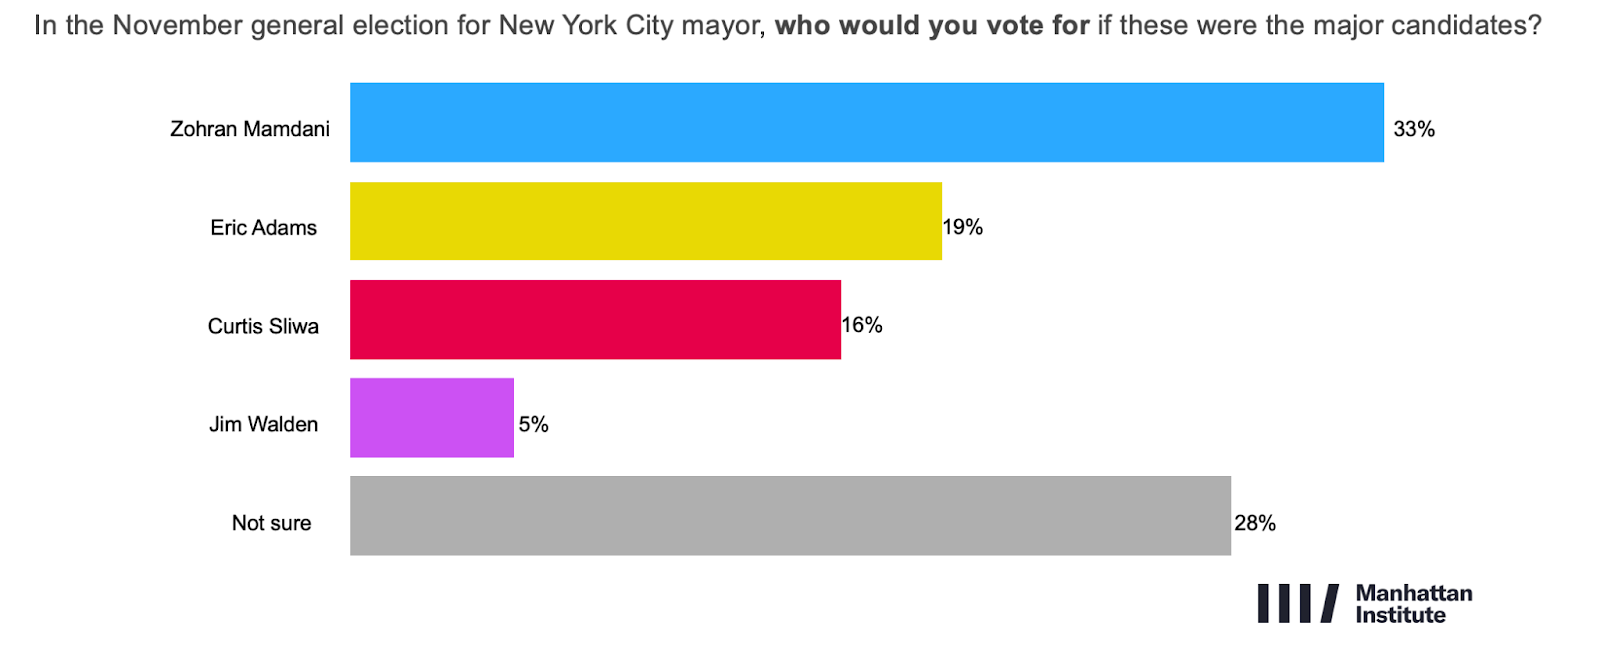
The results show that Cuomo remains the most electable option for Democrats. In a contest with Curtis Sliwa and current Mayor Eric Adams (who intends to run in November as an independent candidate), Cuomo captures 45% of the vote, compared to 13% for Sliwa and 11% for Adams (Figure 5). But if Mamdani were to replace Cuomo as the Democratic nominee, the numbers would shift dramatically. Mamdani’s vote share drops to 33%, while Adams jumps to 19% and Sliwa to 16%—a significantly reduced margin of support for Democratic nominee (Figure 6).
Figure 5: Cuomo wins 45% of the vote in a Cuomo-Silwa-Eric Adams-Walden matchup
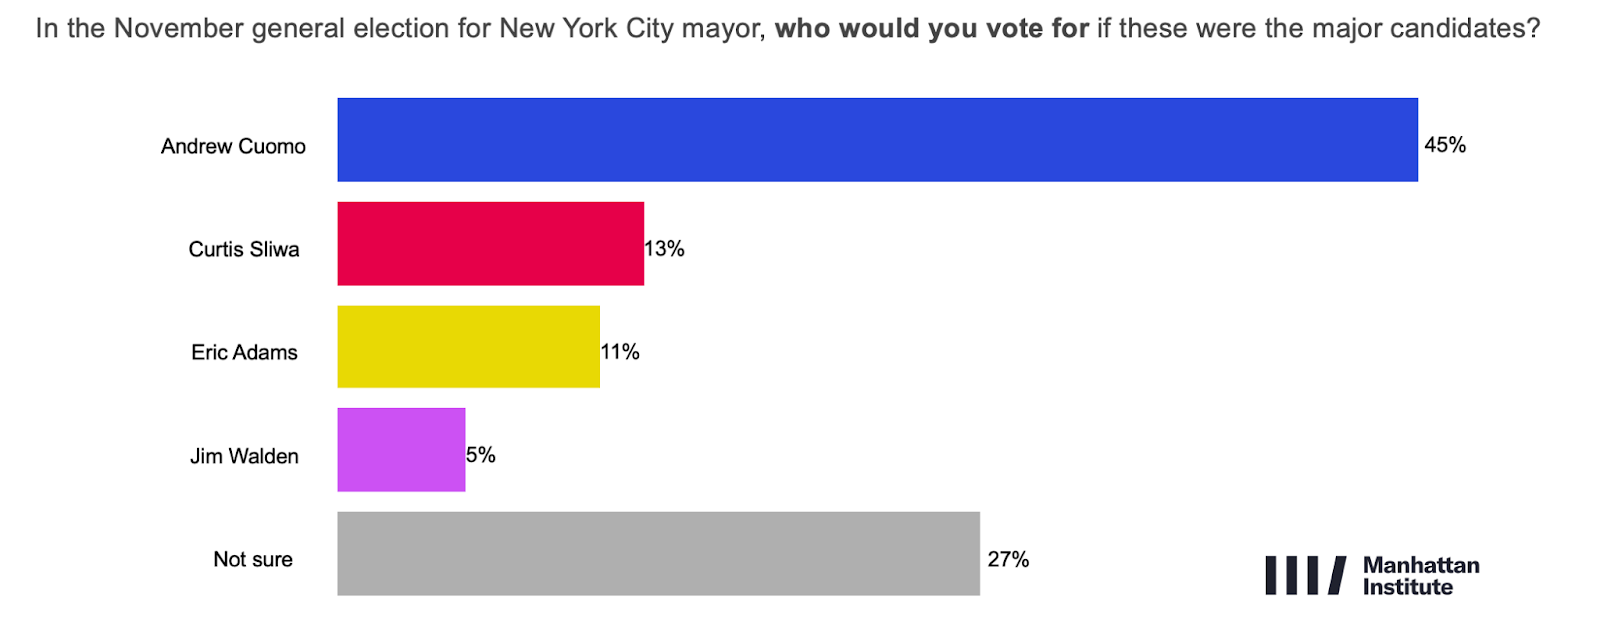
Figure 6: Mamdani wins 33% of the vote in a Mamdani-Silwa-Eric Adams-Walden matchup
The difference is especially stark among black voters. In the Cuomo scenario, 54% of black voters back him, compared to 14% for Adams and 2% for Sliwa. But with Mamdani as the candidate, black voters are nearly evenly split: 30% for Mamdani, 29% for Adams, and 4% for Sliwa.
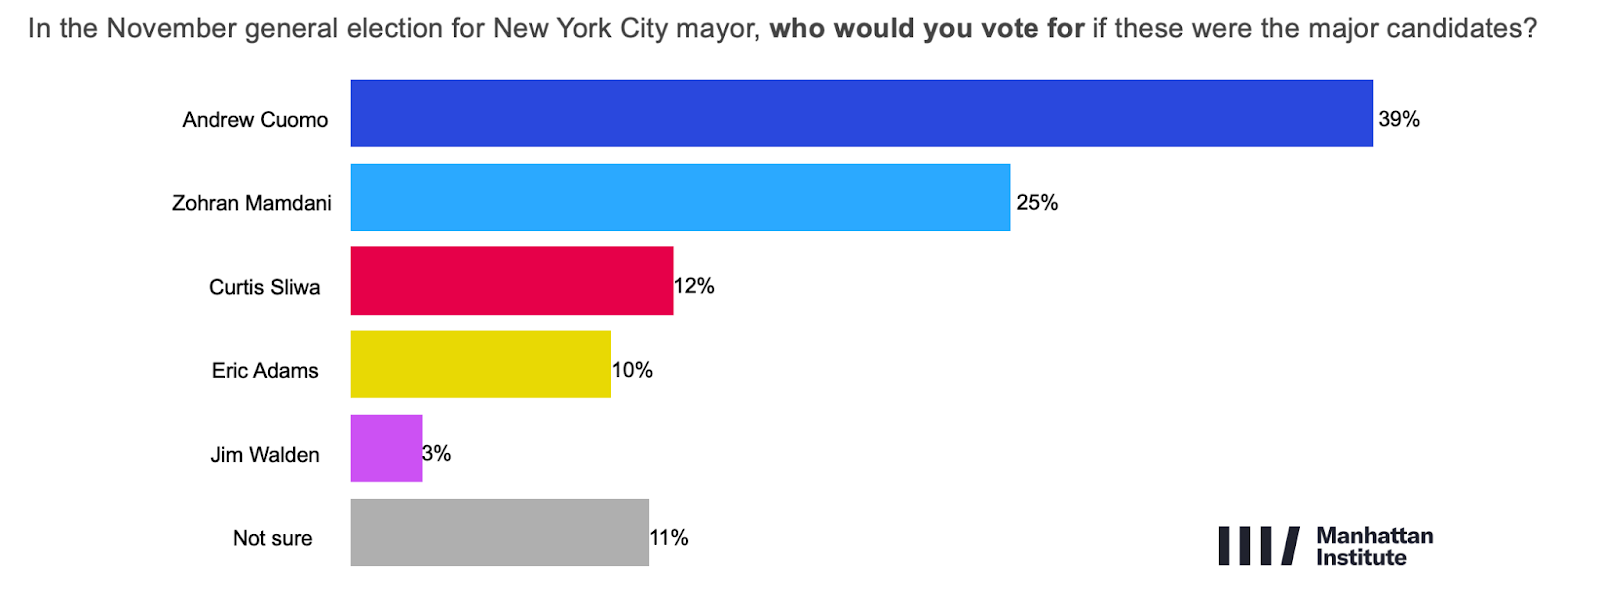
We also tested a five-way race featuring Cuomo, Mamdani, Sliwa, Adams, and Walden (Figure 7). Here, Cuomo leads with 39%, followed by 25% for Mamdani, 12% for Sliwa, and 10% for Adams. Walden receives only 3%. Notably, Cuomo performs better with Mamdani in the race than Mamdani does without Cuomo, suggesting broader crossover appeal.
Figure 7: A Cuomo and Mamdani race ends in a Cuomo victory
In a separate scenario where Comptroller Brad Lander is the leading Democratic candidate, he earns just 30%, with Sliwa at 18% and Adams close behind at 17%—once again pointing to a fractured field and a modest ceiling for progressive candidates.
Across most tested general election matchups, about 27% of voters remain undecided. But when Cuomo and Mamdani go head-to-head, uncertainty drops to just 11%—a sign that the electorate is polarized and locked in. Notably, 73% of Mamdani voters say they’re unsure how they’d vote in a Cuomo-led general, and 44% of Cuomo voters say the same about a Mamdani-led race—evidence of a base-versus-base primary dynamic that could shift by November.
Public sector union endorsements could also move the needle. Public sector union members and members of union households comprise 18% of the electorate, with 44% of union members saying that they are somewhat or very likely to vote for the candidate that their union endorses—4.6% of the overall general election electorate.
Favorability
Among all voters, Speaker Adams and Comptroller Lander hold the highest net favorability (Figure 8), with 44% viewing them favorably and 28% unfavorably (net +15 with rounding). Cuomo, by contrast, is the most well-known: 50% view him favorably, and 47% unfavorably (net +3). Mamdani sits at 42% favorable, 36% unfavorable (net +5 with rounding).
The starkest divide emerges among independents. Cuomo posts a narrow +5 margin with this group (48% favorable, 43% unfavorable), while Mamdani falls deeply underwater—just 24% favorable to 47% unfavorable (net –23).
Figure 8: Adrienne Adams and Brad Lander top the favorability stakes, Elon Musk at the bottom
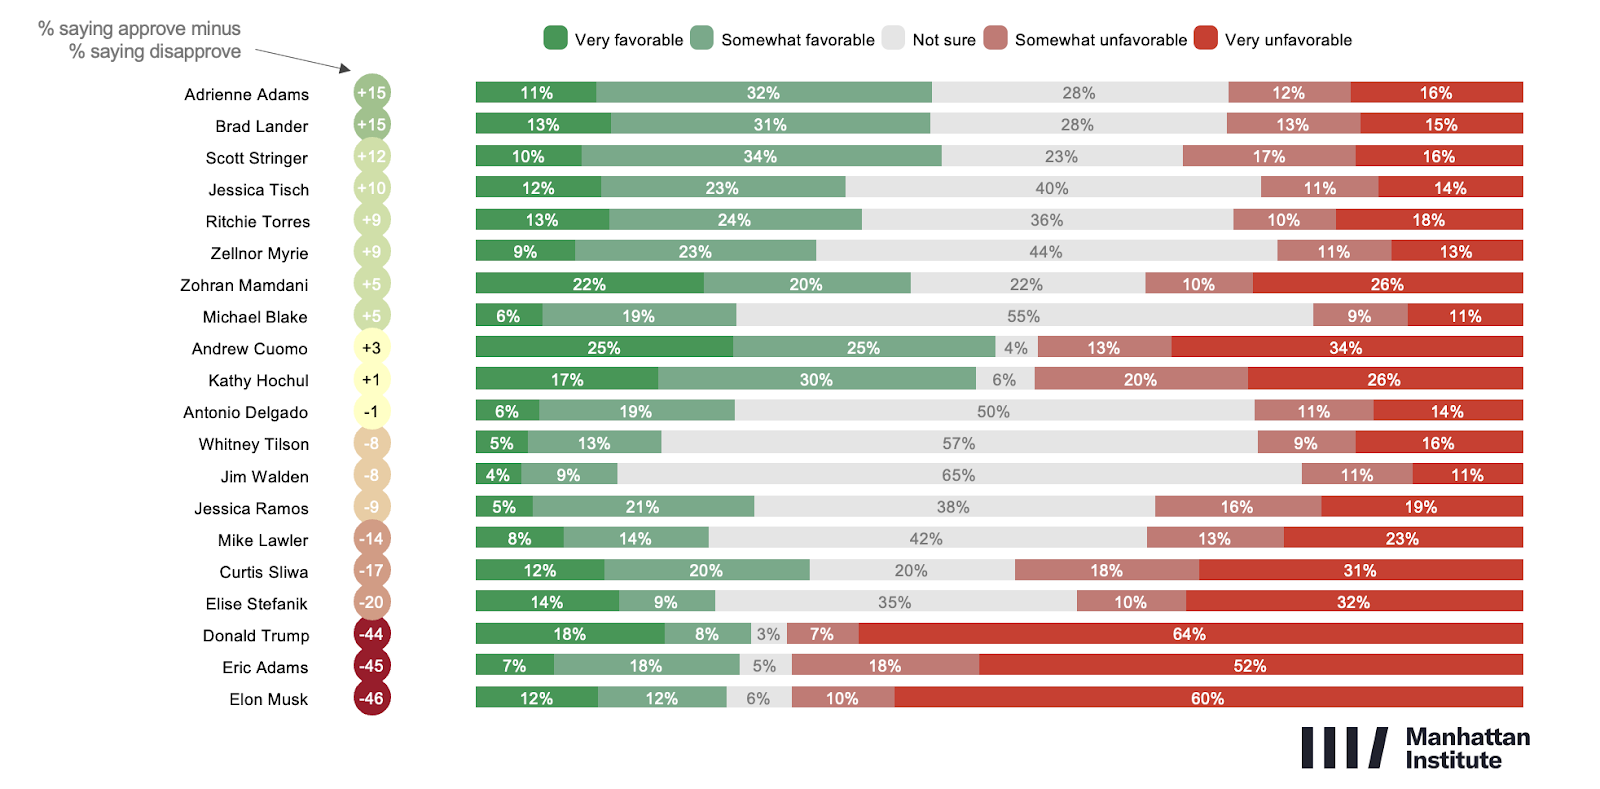
As for other political figures, Governor Kathy Hochul is only narrowly favored by city voters—47% favorable to 46% unfavorable—with particularly weak numbers among independents (35% favorable, 55% unfavorable). Even among Democrats, her standing is relatively weak: 54% favorable, 42% unfavorable.
President Donald Trump and Elon Musk post nearly identical numbers in the city: Trump is viewed favorably by 26% and unfavorably by 71%; Musk by 24% and 70%, respectively. Trump’s strongest support comes from men (33%), voters aged 35–64 (29%), Queens residents (30%), and Staten Islanders (45%).
City Direction and Mayoral Approval
New Yorkers remain pessimistic about the city’s direction. Some 62% say the city is on the wrong track, with only 20% believing it’s headed in the right direction. That mood is broadly shared across party lines: 68% of Republicans, 62% of independents, and 61% of Democrats agree the city is on the wrong track.
Accordingly, Mayor Adams’s approval rating sits at just 27%, with 7% strongly approving and 20% somewhat approving. A full 70% disapprove—including 48% who say they strongly disapprove. Despite being elected as a Democrat, Adams receives slightly higher marks from Republicans (36%) and independents (34%) than from Democrats themselves (24%). No major group in the city views his tenure positively.
Top Issue
The two most important issues to New York City voters are crime and public safety (26%) and housing costs (25%). This is followed by jobs, taxes and the economy (18%). No other issue cracks 10%, with migrants and immigration a top concern for only 7% and public transportation a top priority for 3% (Figure 9).
Figure 9: Crime and housing costs top the issue agenda
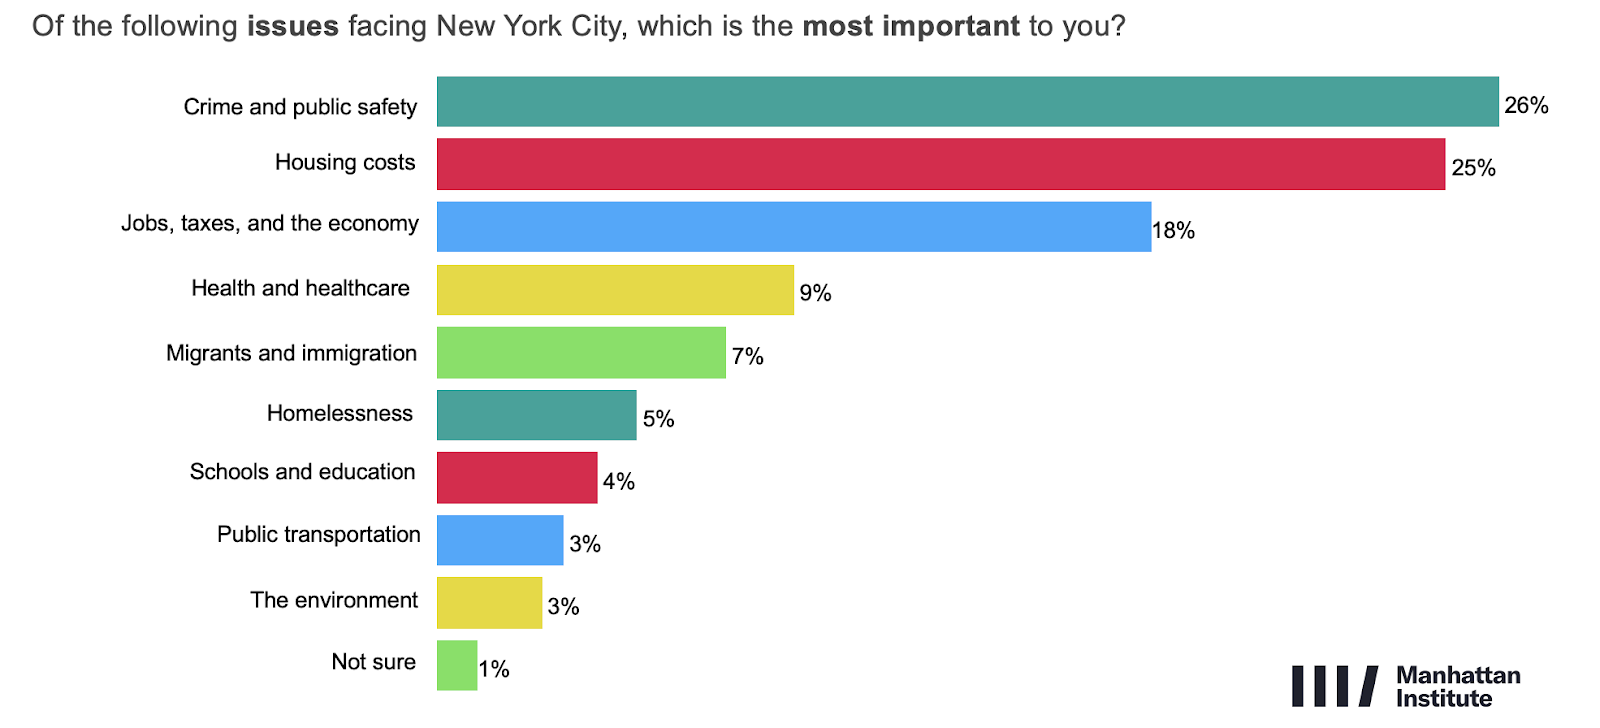
There is a sharp age gradient on the top issue, with older New Yorkers rating crime most highly, while 18–34-year-olds overwhelmingly pick housing as their top issue (45%). Brooklynites are more likely to be concerned about housing, while people in Queens and Staten Island rate crime as a bigger concern. Independents are more concerned by crime (31%) than they are housing (17%) and rate the economy more highly than housing (21%).
Policing
A majority (54%) of New York City voters say they want to see more police officers across New York (Figure 10). Only 17% say they want to see fewer, while 21% say they want to keep the current number as it is.
Figure 10: A NYC majority for more policing
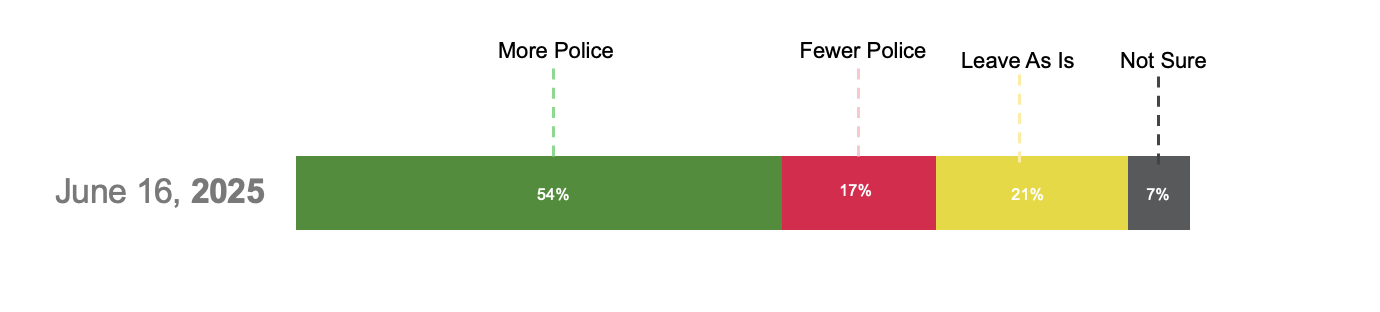
A plurality of every demographic in NYC wants to see more police officers, including Republicans (85%), independents (64%) and Democrats (47%). Voters in Staten Island are some of the most likely to want more police officers, with 91% saying so. Black voters also back more police, with 47% saying so and only 19% of black voters wanting to see fewer.
Education
In recent years, chronic absenteeism has risen sharply in NYC schools. After putting this to voters, 79% said they were very or somewhat concerned by this, with only 16% saying they were not very concerned or not concerned at all. Concern levels are high across every group, including 86% of Democrats.
Migration
Concerns about the city’s migrant influx cut across party and demographic lines. Some 63% of voters say they are either very (37%) or somewhat (26%) concerned about the number of migrants arriving in New York over the past four years. Just 14% say they’re not concerned at all. The concern is broad: 59% of Democrats, 67% of first-generation immigrants, and 66% of second-generation immigrants share it. The one outlier is voters under 35—only 44% of 18–34-year-olds express concern.
Mamdani voters stand out sharply from the rest of the electorate. Just 26% are concerned about the migrant surge; 74% say they are not—almost a mirror image of citywide opinion.
When it comes to solutions, New Yorkers are split three ways:
- 32% support deporting all or most illegal immigrants;
- 27% support granting work authorization without a path to citizenship;
- 32% support a pathway to citizenship.
Even among Democrats, only 37% back a full citizenship pathway. Among first-generation immigrants, support drops to 23% (with 35% favoring deportation and 32% opting for work authorization only).
Once again, Mamdani voters diverge: 68% support a pathway to citizenship, and just 2% back deportation.
Voters are also divided on how the city is handling the issue overall: 35% say officials have been too soft, 28% say the approach has been about right, and 20% say it’s been too harsh. Just 25% of Democrats think enforcement has gone too far. Among Mamdani voters, however, 49% say the city has been too harsh—yet another reminder that their views are out of step with the broader electorate.
Housing
Voters see a dual remedy for affordability: 46% say the city should both streamline approvals for new homes and expand subsidies for renters and buyers. Among those who picked just one approach, 21% favor deregulation, while 15% prefer subsidies.
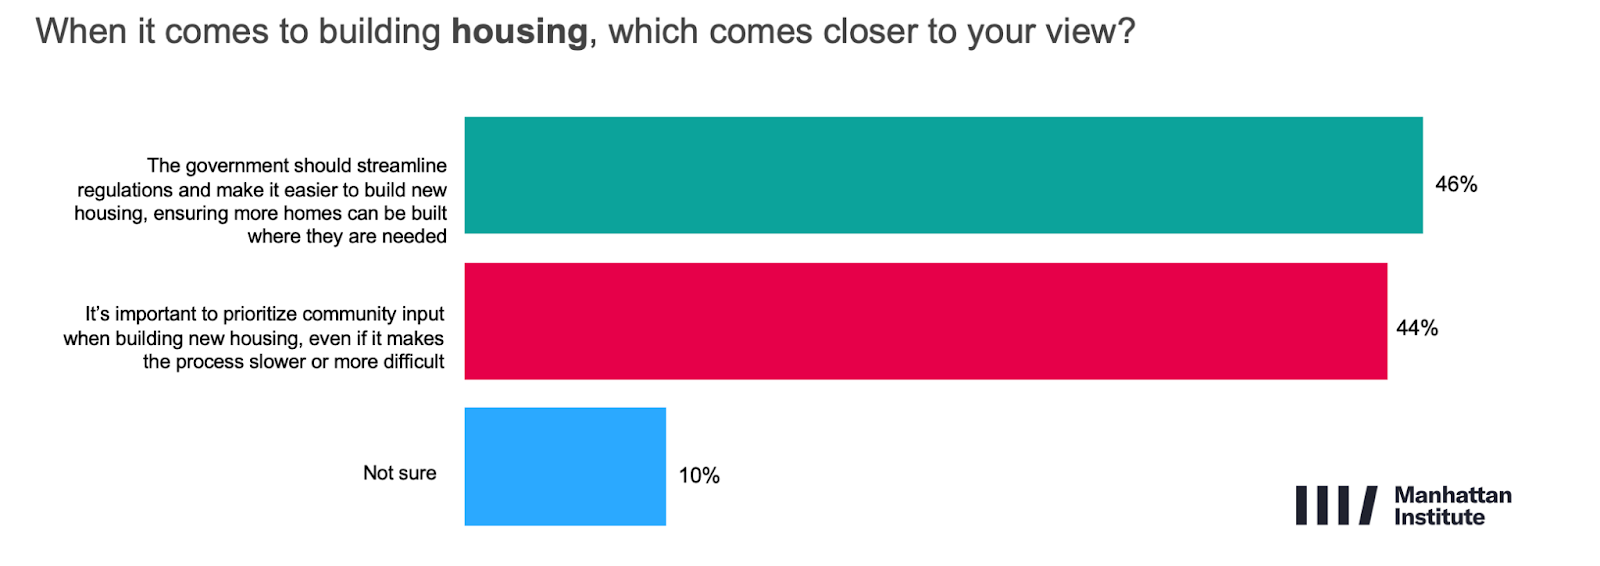
Asked directly, the electorate marginally favors streamlined regulations and making it easier to build new housing (46%) over prioritizing community input when building new housing that may slow the process (44%). These results are shown in Figure 11. There are clear sub-patterns:
- Men favor streamlining by +11 points; women favor community input by +6;
- Younger voters (18–34) lean toward faster approvals (52%);
- Manhattanites are the most YIMBY, 50%–41% for streamlining.
Figure 11: New Yorkers are divided on solutions to the housing crisis, but a plurality support streamlining regulations and making it easier to build over prioritizing community input
Mandatory Composting
Voters are split on the city’s mandatory composting policy: 45% call it a smart environmental move, while 46% say it’s a waste of time and taxpayer money. But beneath the topline, the policy is clearly polarizing:
- Independents oppose it by a near 30-point margin (59% waste vs. 31% smart policy);
- Republicans oppose it 64%–29%, while Democrats support it 51%–40%;
- Support is stronger among college graduates (51%–43%); voters without a college degree lean negative (41%–48%).
In short: composting is a culture-war marker. Democrats and college grads are onboard, but swing voters and working-class New Yorkers are not.
Homelessness and Mental Health
Voters support compassionate interventions—up to a point. Some 60% back converting vacant retail spaces in subway stations into 24/7 drop-in centers for homeless individuals experiencing mental health crises; 29% oppose. Support is especially high among 18–34-year-olds (82%) and Democrats (65%), while Republicans are split (44% support, 44% oppose). And when asked to choose between focusing on outreach and psychiatric services or prioritizing system safety, 63% opt for outreach, while 30% favor a safety-first approach. Republicans are the only group split evenly (45% to 44%).
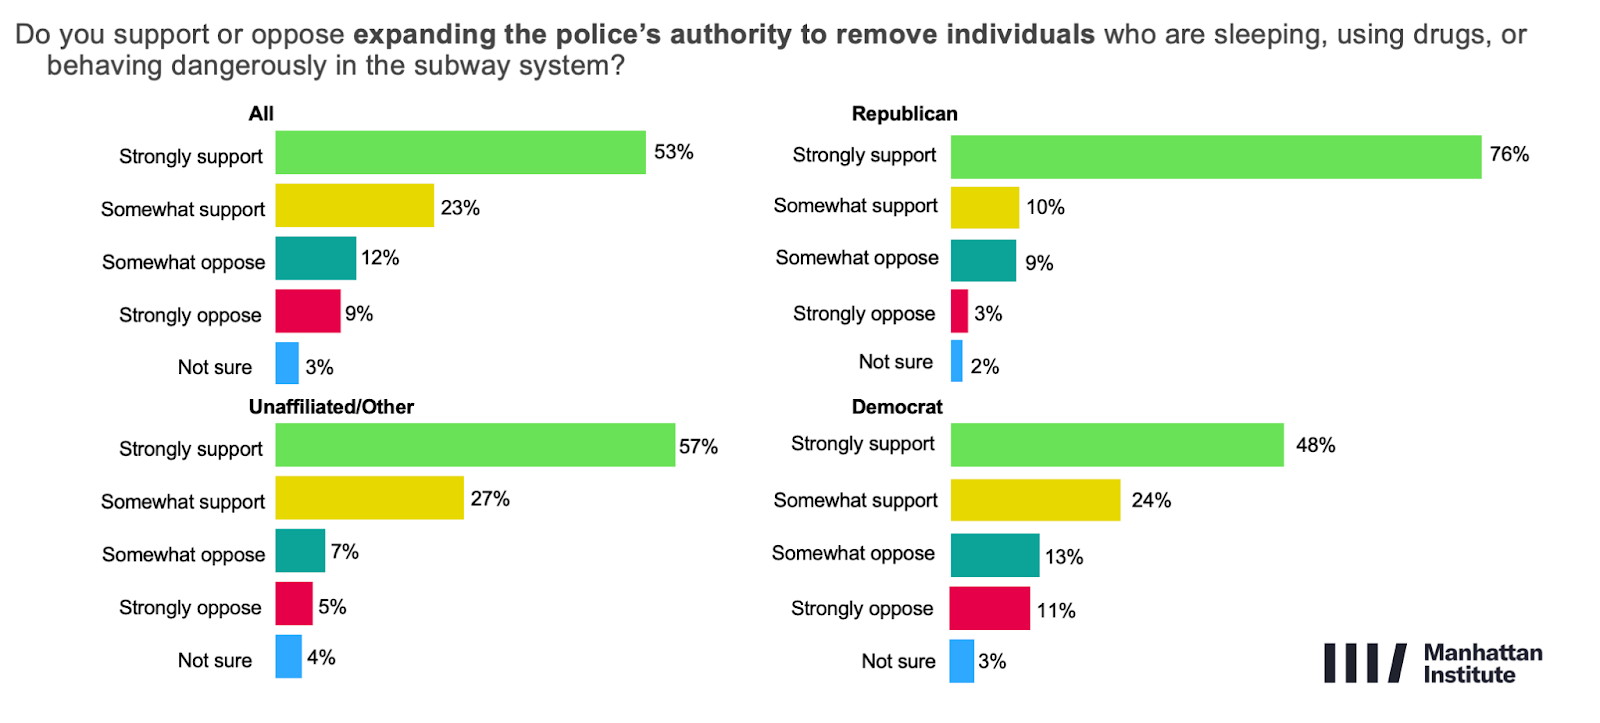
But this is not a rejection of enforcement. Voters express a strong desire for both compassion and control, with 76% supporting expanding NYPD authority to remove individuals who are sleeping, using drugs, or behaving dangerously in the subway system (Figure 12). That includes 86% of Republicans, 84% of independents, and 72% of Democrats; indeed only one group registers net opposition: Mamdani primary voters (63% oppose).
Figure 12: Strong support for basic enforcement on public transportation
Support for basic enforcement remains broad. Some 59% of voters agree that cracking down on minor offenses—like vandalism, public drug use, and fare evasion—is a practical way to keep neighborhoods safe. Only 33% say this kind of enforcement is overly aggressive. Even a majority of Democrats (53%) agree. Once again, Mamdani voters break sharply from the rest of the electorate: 75% oppose enforcement of minor offenses, with just 18% in support.
Photo by YUKI IWAMURA/POOL/AFP via Getty Images
Are you interested in supporting the Manhattan Institute’s public-interest research and journalism? As a 501(c)(3) nonprofit, donations in support of MI and its scholars’ work are fully tax-deductible as provided by law (EIN #13-2912529).


