
By Peter Tchir of Academy Securities
It is twice blest;
It blesseth him that gives and him that takes.
Please forgive the Shakespearean indulgence, but I’m in Waterloo, in Wellington Country, not too far from the Shakespeare festival in Stratford on the Avon (the Canadian version).
But finally, literally everyone is talking about a long-running theme in T-Reports – we need high quality data to make good decisions.
I’ve lost count of the number of times I’ve written or spoken the words “Garbage In, Garbage Out” but it is a real issue with real world consequences.
We didn’t get to talk much about jobs in Tuesday’s Bloomberg TV interview, but we did get to talk about the balancing act of Tariffs vs. National Production for National Security and the importance the strike on Iran has had on U.S. relations with our allies.
While we won’t focus on it today, the court rulings on the legality of existing tariffs could impact markets.
Our Geopolitical Intelligence Group crafted a report on the announcement that the U.S. is moving two nuclear subs, which spooked markets, but is another example of some steps, that while potentially dangerous, are necessary in reestablishing deterrence and building Peace through Strength (see SITREP).
Imagine an “Alternate Reality” July 3rd
Imagine that on July 3rd, we had a June NFP headline of 14,000 jobs instead of 147,000.
Let’s further imagine that May’s reported number was 19k, instead of whatever had been reported at the time.
It is easy if you try, since ADP was -23k and 29k respectively (why the markets and the Fed consistently ignore ADP is beyond me, but that is an argument for another day).
If we had that jobs data, would this FOMC been different?
Maybe we wouldn’t have gotten a cut, but why the heck not? We had 2 dissents as it was. With this No Silver Lining Jobs Data, there would have been a lot of pressure to cut. The unemployment rate, which hasn’t been bad, has largely been stable because we have seen a 0.4% reduction in the labor force participation rate since April.
Certainly, my flight back from London would have been more enjoyable as the data would have been even worse than my already pessimistic views and Treasuries could have continued their strong performance. It isn’t just our view that was hit by data that now looks very incorrect. On the July print, if memory serves, only 1 economist surveyed had an estimate that was higher. Now, it looks like in hindsight, that every estimate was above the actual number (though closer on average to the original print).
The real-world impact of having inaccurate data is problematic (and let’s be honest, for all we know this month’s data will be revised higher next month – which doesn’t change the argument that Garbage In, Garbage Out needs to be addressed).
It’s Not Just Jobs Data
We have often made well-reasoned arguments (some would say, rants) around incorrect inflation data. The owners’ equivalent rent is fraught with issues, including significant lag time. We’ve argued that the country voted based on the inflation they saw in the real world, not the calculated inflation (which seemed low on many things – like health insurance costs). Many look to things like Truflation to get potentially more accurate, real-time information (though not sure what good it does, if policy makers don’t).
The jobs data has caught everyone’s attention, it is time to address data across the board.
Let’s not forget we live in an electronic and AI world, which should help us get better answers.
Two Problems
The Collection Problem.
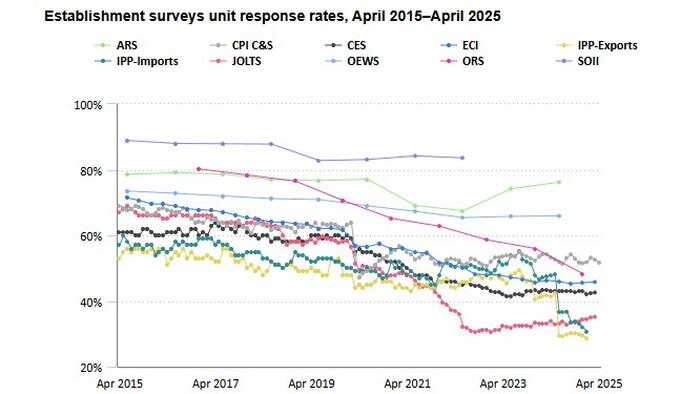
- Survey Response Rates. The initial survey response rate has been between 25% and 35% for the past year. Prior to 2020, the initial response rate averaged close to 70%. We now get less than half of the initial responses than before, and that seems problematic.
- By final revisions, the response rate is typically above 90%, even approaching 98%. Maybe we should stop pretending NFP is timely? If we get far more respondents after the initial publication, it isn’t surprising that the data is all over the place.
- There are collection problems on almost any data series. It is part of living in the real world, but how do we address these problems and try to minimize them?

The Seasonal Adjustment Problem.
- Even if the underlying data was perfectly accurate (it isn’t) we move on to the “seasonal adjustments.” We “love” adjusted data as it provides “smoother” data. Apparently we couldn’t handle that the Non-Seasonally adjusted jobs were -1.07 million, +360k, +703k, and +825k for the past four months (in all honesty, I don’t know whether those have been adjusted or not via revisions, but that is the actual jobs data).
- Is there any reason to believe that the BLS (or anyone) has the “best” seasonal adjustment methodology? I think not, as I’d like to see as many different estimates as possible.
So, we have all these incredibly smart, well-resourced economists trying to do 1 of 2 things:
- Determine, to the best of their abilities, the number of jobs created.
- Guess what the jobs numbers calculated by the BLS will be, and then guess what the adjustments will be. To the extent that this is prevalent, it reduces the impetus to change existing official methodologies.
While “similar” the two things are very different.
The first is a truly valid exercise in establishing where the economy stands and providing data to make good decisions. Despite that, it is somewhat useless if no one believes you and just gravitates to the officially published data.
The second is what makes careers. Bloomberg reports analysts that are most “accurate.” Not accurate in terms of what the final data comes in at, but at predicting the pseudo random number that comes out the first Friday of the month (or other dates, for other data series).
My bet gravitates towards the crowd-sourced efforts of economists trying to predict the actual state of the economy (though I’m not sure if that is the goal of many, or trying to guess the NFP is the goal, which is similar but different).
Some Food for Thought on Solutions
Enough ranting and rehashing old arguments. Let’s take a peek at some potential solutions, or at least some ideas that we think warrant discussion.
Getting the most accurate, timely data as possible.
Every year, our employers send the IRS our tax forms, that include our income and our Social Security, so the IRS can link all of our employment income together. W2s and 1099s have to cover a significant part of the legal work force. Maybe I’m wrong, but I would expect that W2s and 1099s would cover a large percentage of the legal, documented workforce. It misses under the table payments, all cash jobs, and probably some sole proprietorship jobs, but virtually everyone I know receives at least 1 paycheck a month (some are weekly, or biweekly).
So how about providing some “encouragement” for companies to provide that information every month?
- Privacy concerns? Sure, but the federal government (IRS), and probably your state will all get this information over the course of time. Does it really matter whether they know your monthly data in addition to the annual data? Sure, my initial reaction is that this seems sketchy, but is it really? Certainly, some information could be “redacted” so individuals don’t stand out (though it would still likely need to be collated by SSN to determine those working multiple jobs). 1099s may pose some similar issues (by SSN or EIN), but it seems like something that should be “workable.”
- What do we mean by “encourage”? Maybe a reduction in certain payroll taxes. Maybe even a small rebate to the company and/or the employee. Would this cost some money? Yes, but would the cost be more or less than living with data that is so unreliable that it leads to bad decisions at the policy, corporate, and even individual level? Data collection in any form tends to have expenses, but doing something to encourage (or mandate) timely data would be interesting.
Just imagine a world where on the 20th of each month (just to pick a date) anyone cutting checks that will show up on W2 or 1099 reports, sends (in an identical format) the information to the data collection area (probably involving the IRS, as they are the ones already entitled to this information on an annual basis).
That data is plunked into an algo that then comes up with changes in employment.
Would we be missing some parts of the economy? Sure. Without a doubt. But would we have highly accurate information on the vast majority of the economy? Probably. This part of the jobs report could be published as such. Then we can all try to spend time figuring out what is happening in the part of the economy that is not captured.
Again, I’m not advocating for giving up our privacy, but the reality is that the information goes to the government, just not in this organized or frequent type of approach. I presume companies or payroll companies could code this additional step in a matter of weeks. Yes, maybe I’m missing a lot of legal issues, but can this really be worse than a survey?
I would also like to see some “cohort” analysis. What I like about Case-Schiller is that it tracks a set of houses, not every house. There is effectively a “control” group. For wage inflation, it would be great to see data by cohort. Track the wage of a particular person over time. When we think about wage inflation, we think about what people get paid over time. This sort of methodology would mimic that. It could also potentially be done by income bracket (now this might be going too far, but just tossing it out there). What we currently get on average hourly earnings is a change in the entire pool of workers. But if someone retires and is replaced by a new employee at a much lower wage, the current methodology would likely see lower wage inflation than there really is. Tracking by cohorts over time may give a better read on wage pressures than existing methodologies. This is a second order effect, but hey, why not try to make a really robust report?
Open source the seasonality. Let’s publish both the unadjusted number (as volatile as that is) along with the adjusted number and the algorithm used to do that adjustment. Then the brightest or most curious minds can try to improve it. In this day and age, I wouldn’t bet against a group of kids in college playing around with the methodology and figuring out improvements – especially if we have reduced the range of issues around the data collection.
Whether or not these ideas make any sense, there should be some simple steps taken.
- Identify and implement ways to reduce the margin for error on broad swaths of the labor force. The more data that can be collected very accurately means we have less to worry about on the data that isn’t calculated as accurately.
- Then focus on ways to reduce the errors in the data that isn’t as accurately collected.
- In parallel, work on ways to ensure that the adjustments are realistic and up to date with the current economy (a major shift in jobs (like AI and Data), or the GIG economy, or regional preferences as where people live and work has changed). Adapt and refine.
Finally, and this might sound weird, stop pretending that the data is accurate to the nth degree.
Imagine having only a yard stick with no measurements marked in between. Then being asked to use that yardstick to measure a long distance over a hilly, rocky field. You take that yardstick and to the best of your ability, flip it over and over, counting the number of flips until you have traversed the field.
Then you come with an answer of 3,423 yards and 12 inches. There is no way the methodology laid out can produce something to that degree of accuracy. Maybe you could say that given the terrain, slippage, etc., we estimate between 3,400 and 3,500 yards, which isn’t as satisfying as 3,423 yards and 12 inches, but does convey a more accurate assessment of the situation. Significant figures exist in science for a reason, to avoid creating the perception of more accuracy than there really is. Maybe more of our economic data should incorporate that concept?
Maybe we need a warning note along with the data?
We are getting warnings about almost everything these days. Objects in the mirror might be closer than they appear. Not eating fully cooked food. You get the idea.
Maybe the warning label should be:
Before using this data, the margin for error is 136,000 for the Establishment Survey. Yes, the margin for error is larger, in some cases, than the actual number we report. Please rely on this data at your own risk as it may or may not be accurate, may be changed multiple times in the coming months, and again in annual revisions. If you think that is a wide margin of error, then we warn you not to even think about the margin for error in the Household Survey. BLS Technical Notes.
Bottom Line
I do not believe that the BLS intentionally gets anything wrong in either direction, but I do believe that in an era with so much of the data floating around electronically and the ability to apply hardcore computing power to that, we should be reinventing our data collection and publication tools to the greatest extent possible (I would include inflation and other important metrics in this project).
I do not like the idea of “shooting the messenger” as that doesn’t create the goal of true intellectual honesty in developing new and better tools.
Garbage In, Garbage Out should no longer be acceptable, and we should be able to corral the will and the resources to mitigate that risk.
End rant, and have a great weekend!
Loading recommendations…


