President Donald Trump signed the One Big Beautiful Bill Act (OBBBA) into law in a White House Ceremony on July 4, 2025. Some are also referring to the legislation as “The Working Families Tax Cuts” to emphasize the relief it offers to American families. The bill, which covers tax and non-discretionary spending, passed in the Senate on July 1 by a vote of 51 to 50 with Vice President J.D. Vance casting the tie-breaking vote. Only two days later, on July 3, the House adopted it without changes by a vote of 218 to 214.REF Because Republicans held razor-thin majorities in both the House and Senate, the fate of President Trump’s signature legislation remained in doubt until the morning it passed in the House. The House had advanced a different version of the legislation on May 22 by a single vote, after which the Senate spent nearly six weeks ironing out changes to the House bill. The legislation that came out of this process will reduce individual taxes in every part of the country and, more important, will prevent what would have been a large tax increase if Congress had failed to extend the expiring 2017 tax reforms.
The looming expiration of many provisions of the 2017 Tax Cuts and Jobs Act (TCJA) provided the main catalyst for the “big” tax bill. Beginning on January 1, 2026, individual tax rates were scheduled to rise nearly across the board, the standard deduction and child tax credit would both have been cut in half, and 37 times as many Americans would have been forced to pay the alternative minimum tax, among other effects.REF Taxes would have been higher throughout the country, and many Americans would have paid significantly more in federal taxes in 2026 than they ever had before.
The OBBBA made almost all expiring TCJA provisions permanent, thereby preventing a major tax increase in 2026. Moreover, it further reduces most Americans’ individual income taxes with modest changes to tax brackets, an additional increase in the standard deduction and the child tax credit, an increase in the cap on the state and local tax (SALT) deduction, and new deductions for tips, overtime, and seniors, among other changes.
This Backgrounder quantifies the tax savings from the OBBBA over time, across states, and across more than 100 areas within states. It shows how federal taxes on individuals and families would have risen in every part of the country had the TCJA been allowed to expire, and how tax levels will instead fall everywhere because the OBBBA was enacted. This Backgrounder also discusses how the legislation’s temporary increase in the SALT cap drives notable regional differences in the OBBBA’s tax savings within the five years after enactment compared to the following five years when the SALT cap is scheduled to return to its pre-OBBBA level. Next, this Backgrounder explains how the OBBBA compares to previous tax cuts in magnitude and describes the relative balance of the tax cuts. It concludes with recommendations for Congress.
The Impact of the OBBBA’s Tax Cuts on the Average American
This section describes individual income tax savings from the OBBBA by year through 2034, quantifying tax savings in different states, metropolitan areas, and other geographic divisions within states. The analysis was conducted using the Heritage Foundation Individual Income Tax Model (HFIITM).
The model captures most of the significant changes to individual income taxes that would have occurred had the TCJA expired, including changes to:
- Individual tax rates and brackets,
- The standard deduction,
- Personal exemptions,
- The child tax credit,
- The qualified business income deduction,
- The alternative minimum tax,
- The SALT deduction, and
- Miscellaneous other itemized deductions and itemized deduction limitations.
The results separate the effect of extending the TCJA’s expiring provisions from the effects of the new tax cuts under the OBBBA. The new tax cuts under the OBBBA include further changes to some of the provisions listed above (including tax brackets, the increase in the standard deduction and the child tax credit amounts, changes to the AMT exemption, and an increase in the SALT cap). In addition, the HFIITM computes the tax savings associated with the following new individual provisions in the OBBBA:
- The tax deduction for tips,
- The tax deduction for overtime pay,
- The new deduction for seniors, and
- The limitation on the benefit of itemized deductions.
Some individual provisions, such as the deduction for domestic car loans (a $30.6 billion tax cut over 10 years according to the Joint Committee on Taxation), the new investment accounts for babies and young children known as Trump Accounts ($15.2 billion over 10 years), and various smaller provisions are not modeled in the HFIITM and are therefore excluded from this analysis.REF Unless otherwise noted, the analysis below also does not include changes to corporate taxes, the death tax, or the nonprofit sector.
If the TCJA provisions had expired, individual income taxpayers would have begun paying higher taxes starting in 2026. The OBBBA prevents the expiration of the TCJA and implements new tax cuts, most of which took effect immediately. Some of the new tax cuts are permanent, and others are temporary. The provisions that were included as fulfillments of President Trump’s campaign promises—the tax deductions for tips, overtime, seniors, and domestic car loans—will remain in effect through 2028. The increase in the SALT cap will remain in effect through 2029. Most other new individual tax cuts in the OBBBA—including enhancements of the child tax credit and the standard deduction and changes to tax brackets—are permanent.
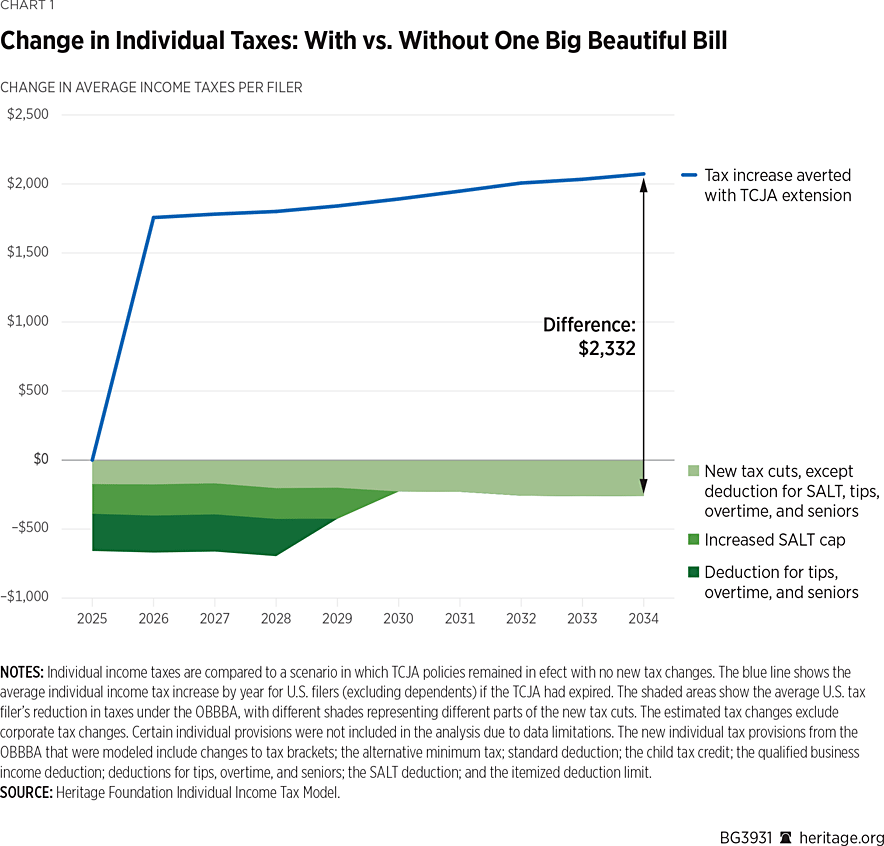
The average individual income tax filer would have paid $1,757 more in taxes in 2026 if the TCJA had expired (compared to the tax policies in effect in 2024), $1,781 more in 2027, and $2,073 more by 2034. The average individual tax savings from the new tax cuts in the OBBBA will be about $672 per year between 2025 and 2028, about $425 in 2029, and about $247 per year between 2030 and 2034. For the 10 years from 2025 through 2034, the average individual taxpayer will save a total of about $17,132 from extending the TCJA plus about $4,351 from the OBBBA’s new individual tax cuts ($21,483 combined).
Regional Analysis of the OBBBA’s Individual Tax Savings
The OBBBA will reduce individual income taxes for taxpayers throughout the country. Between the new tax cuts and the extension of the TCJA, the average taxpayer in the median state will save approximately $2,417 per year between 2026 and 2034 due to the OBBBA.REF
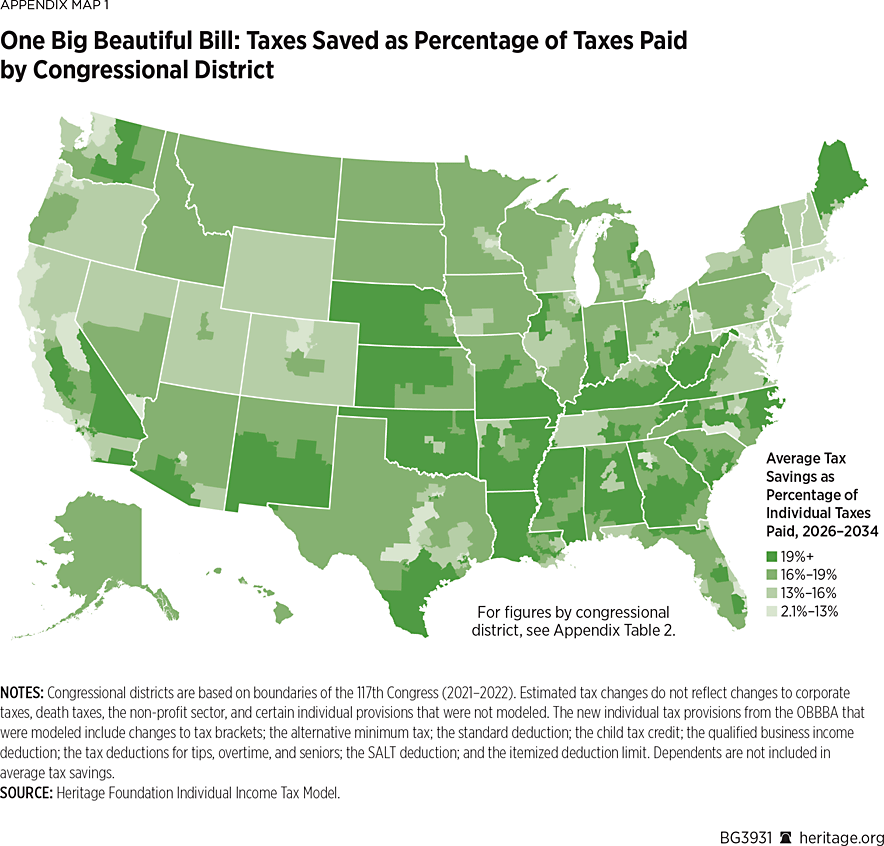
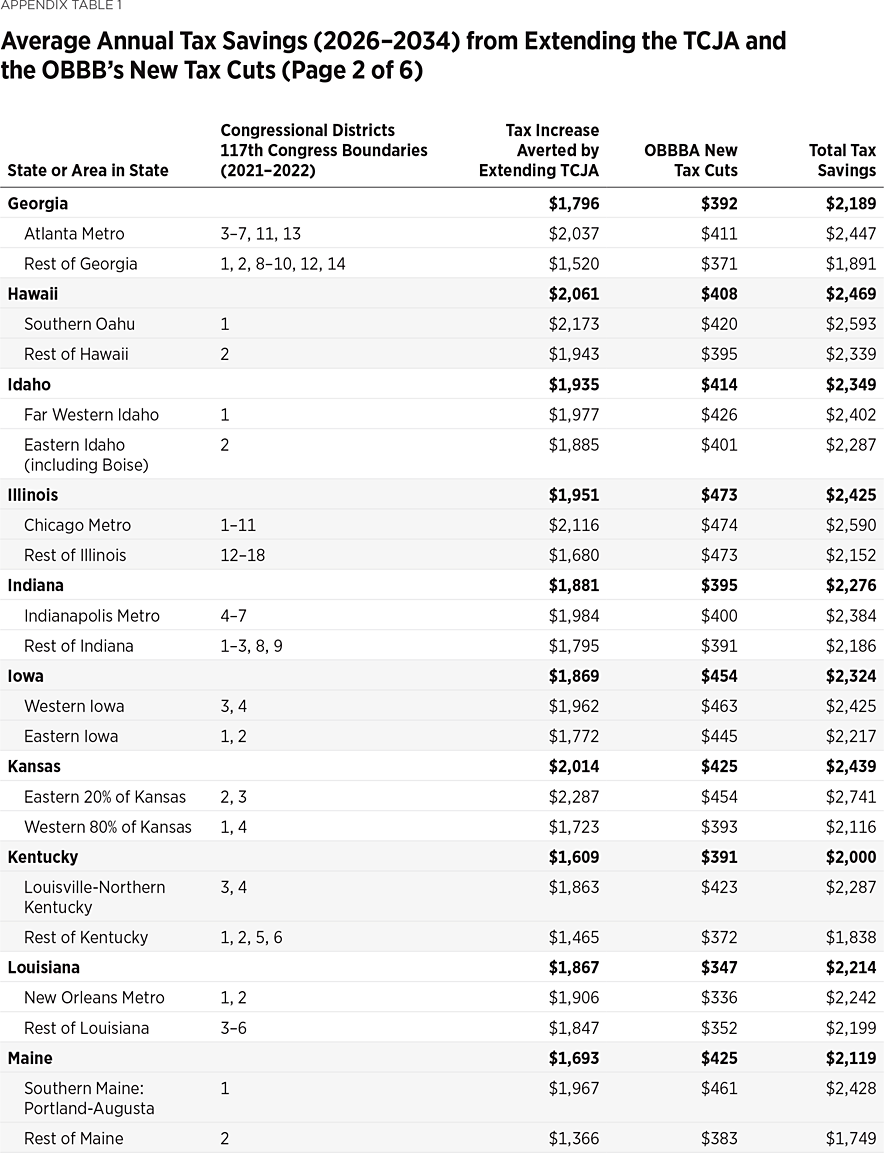
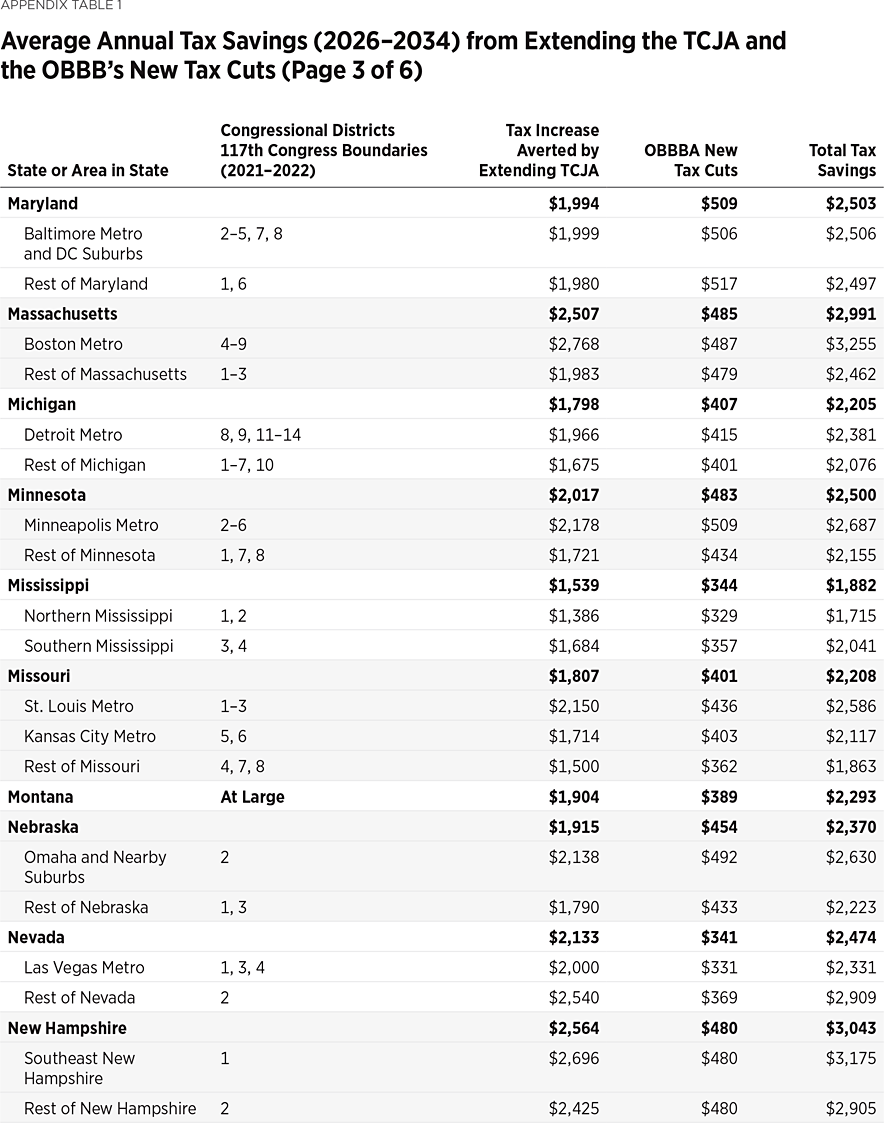
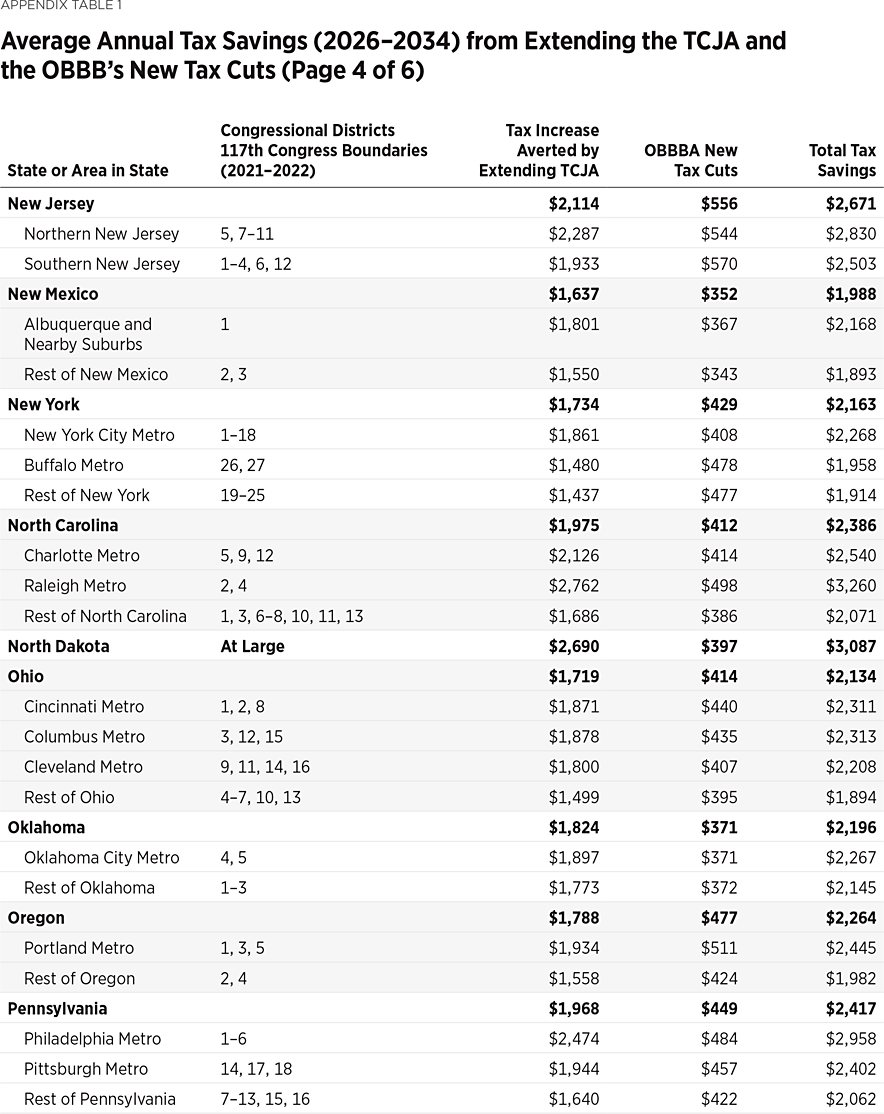
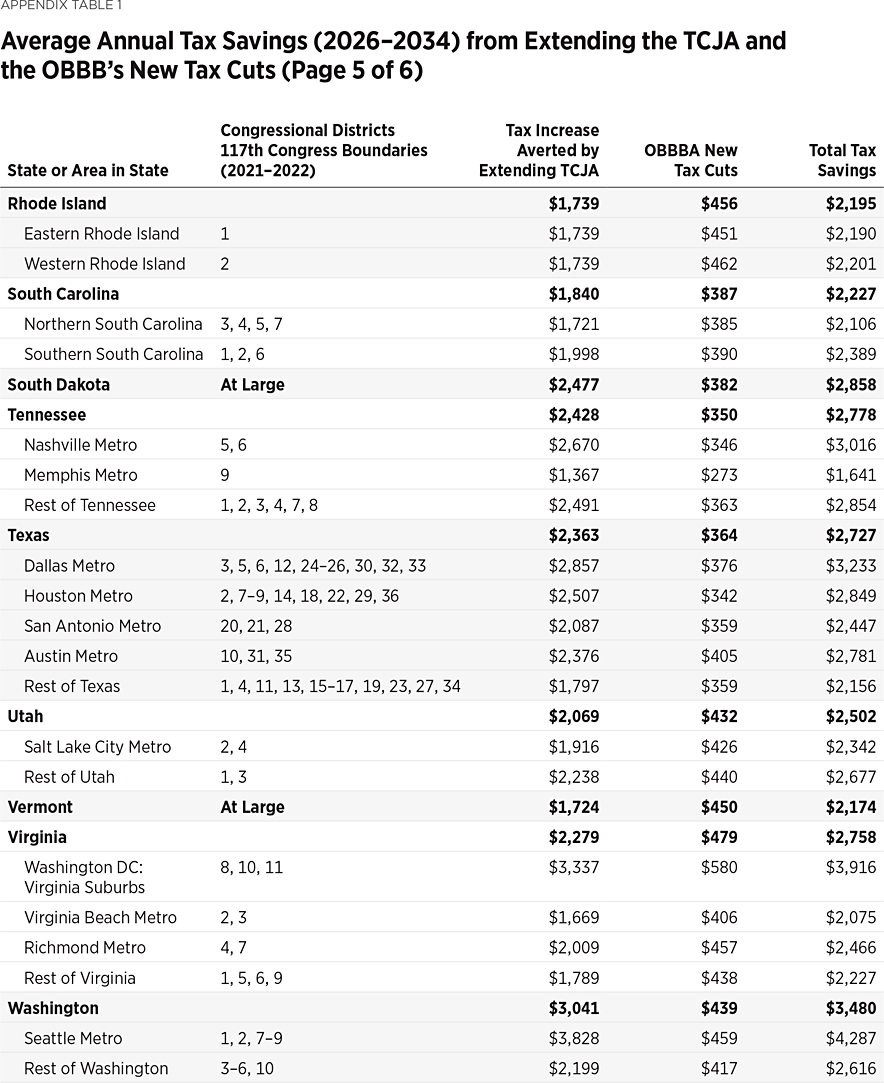
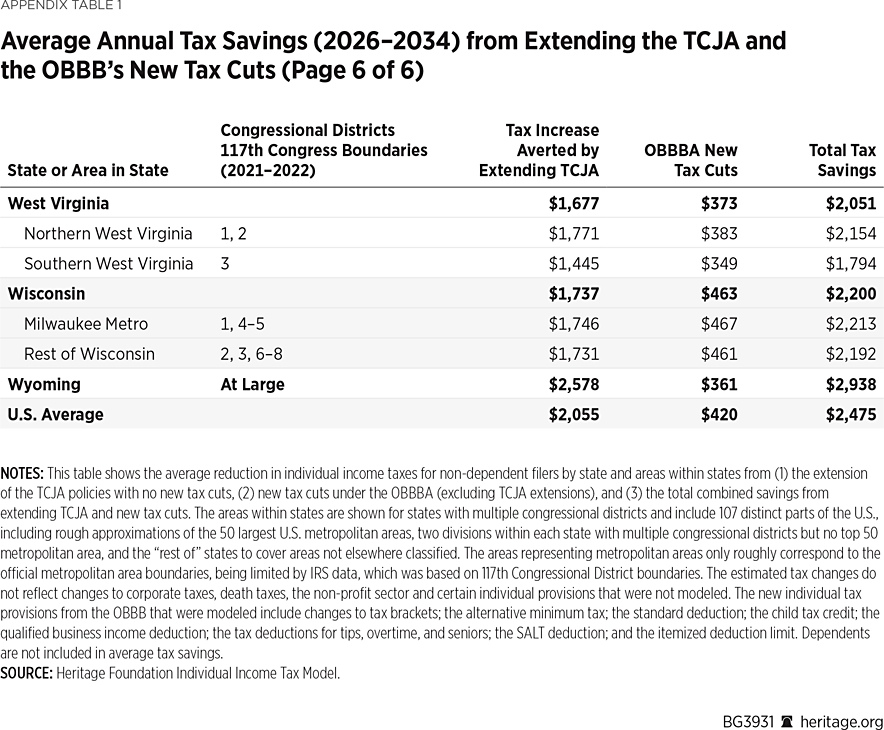
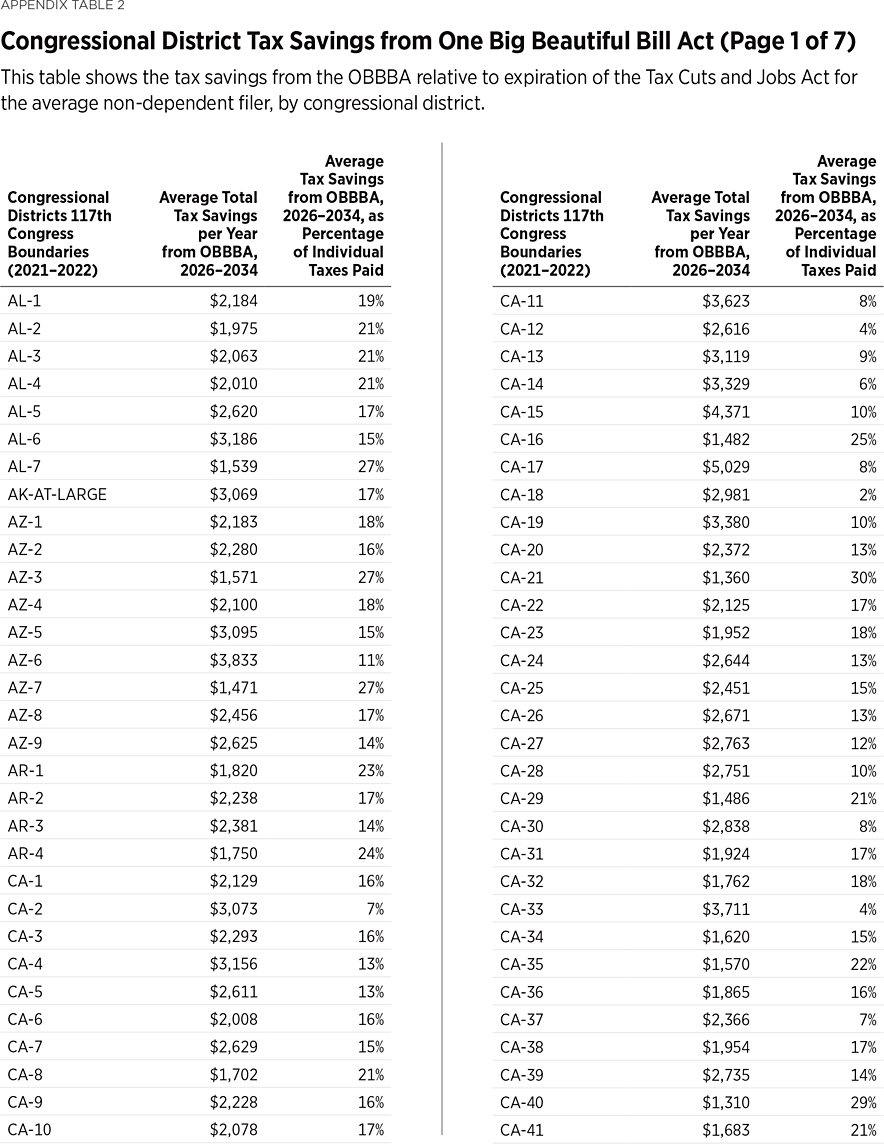
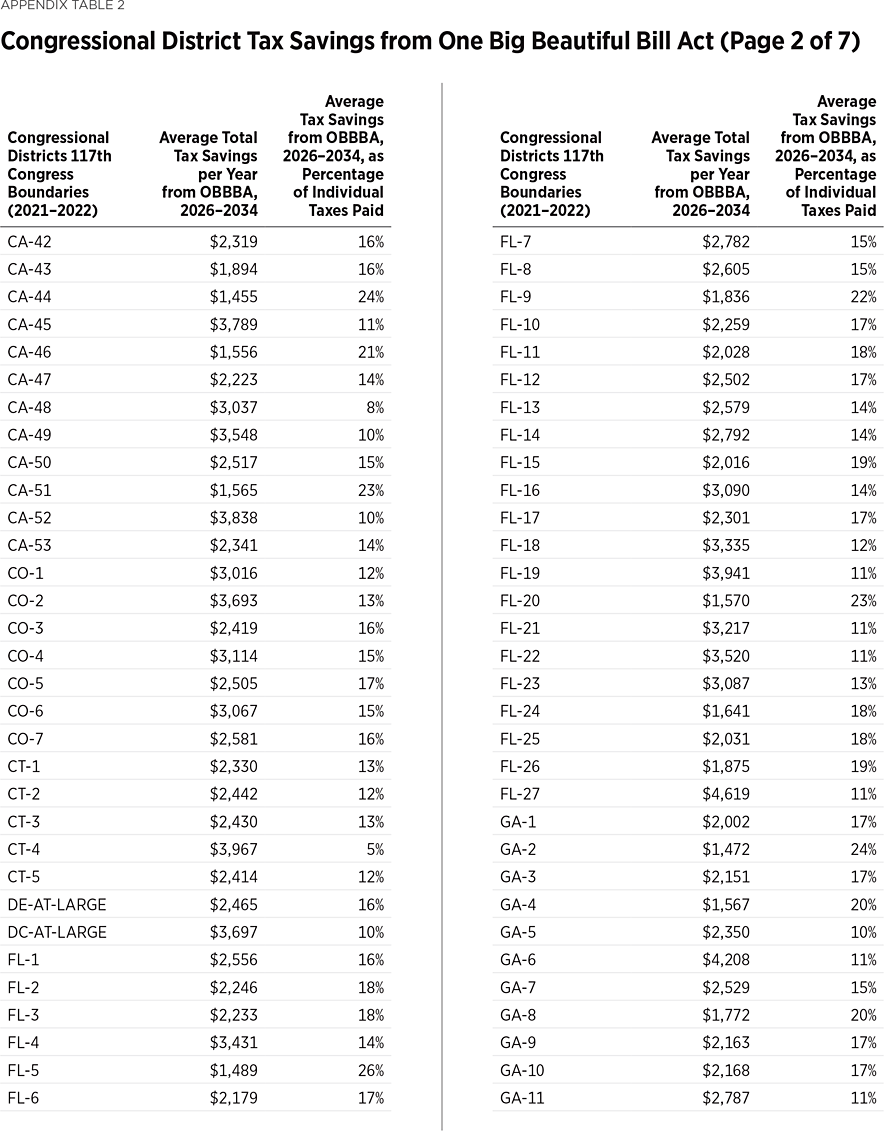
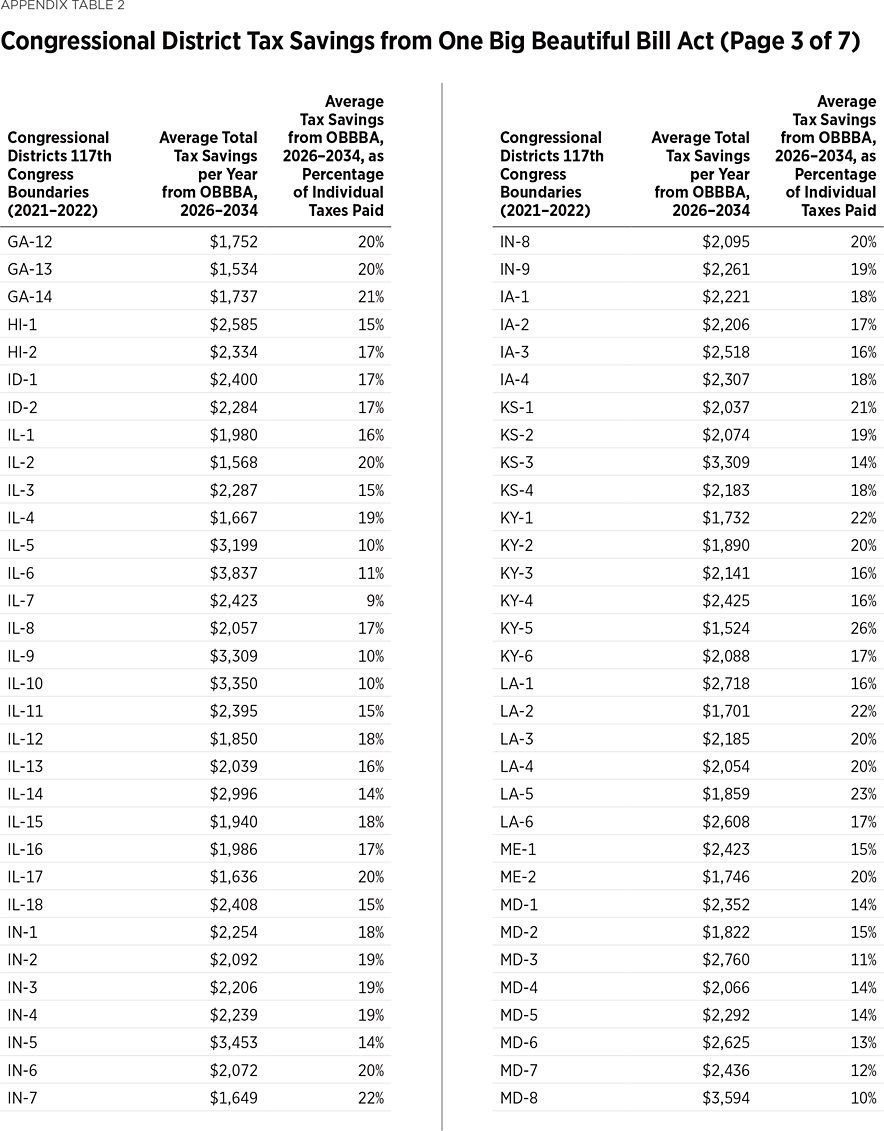
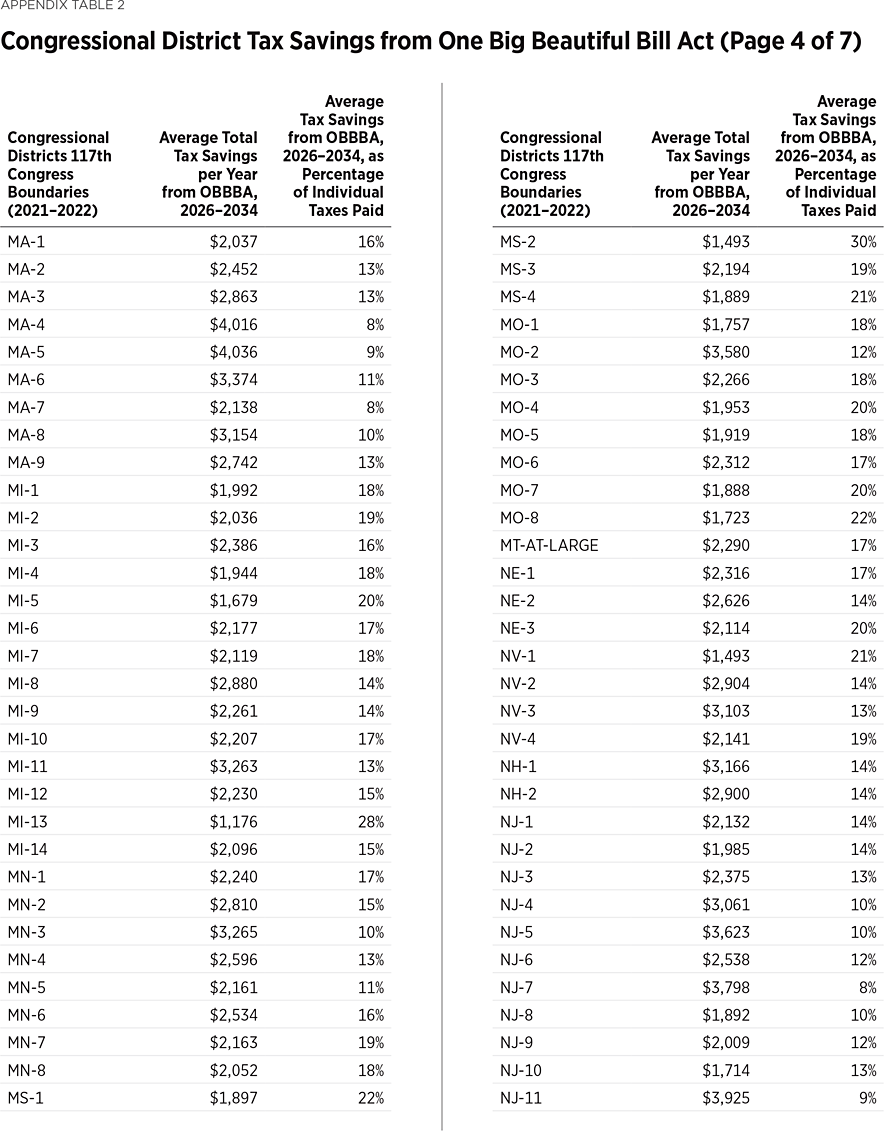
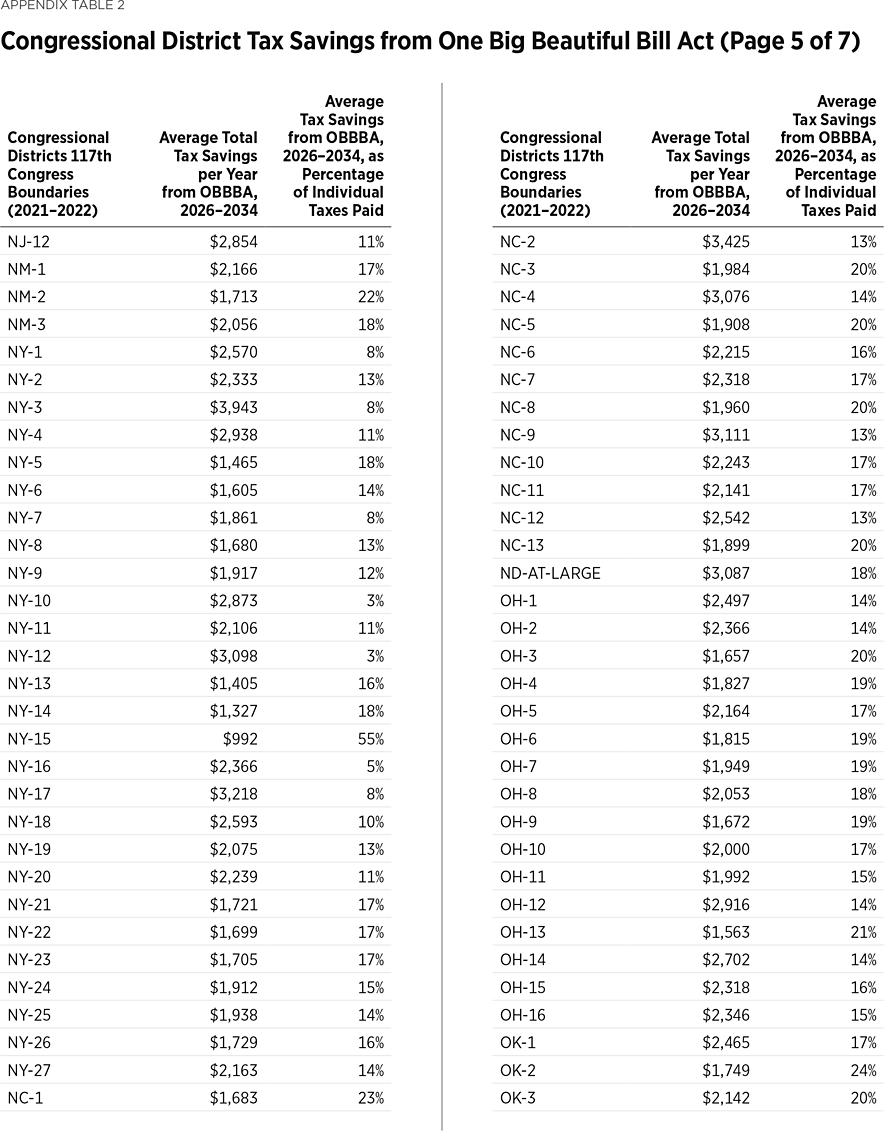
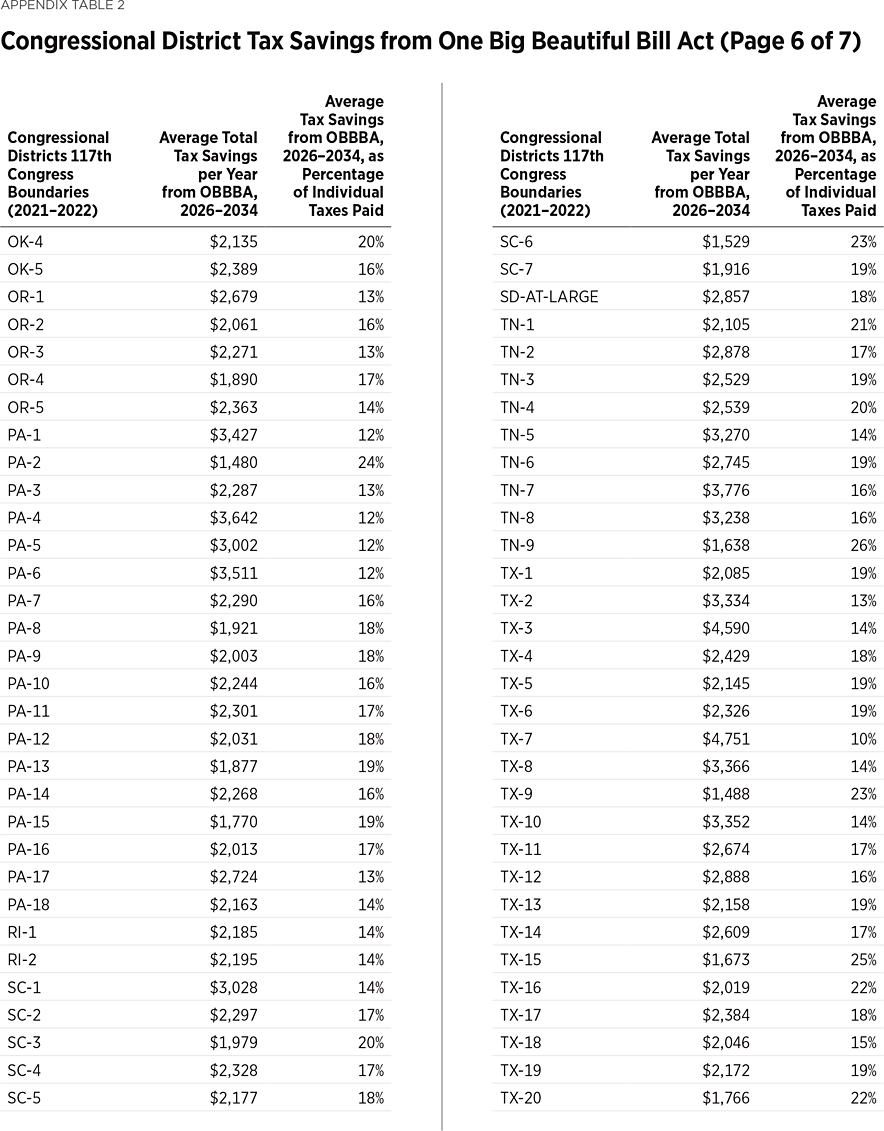
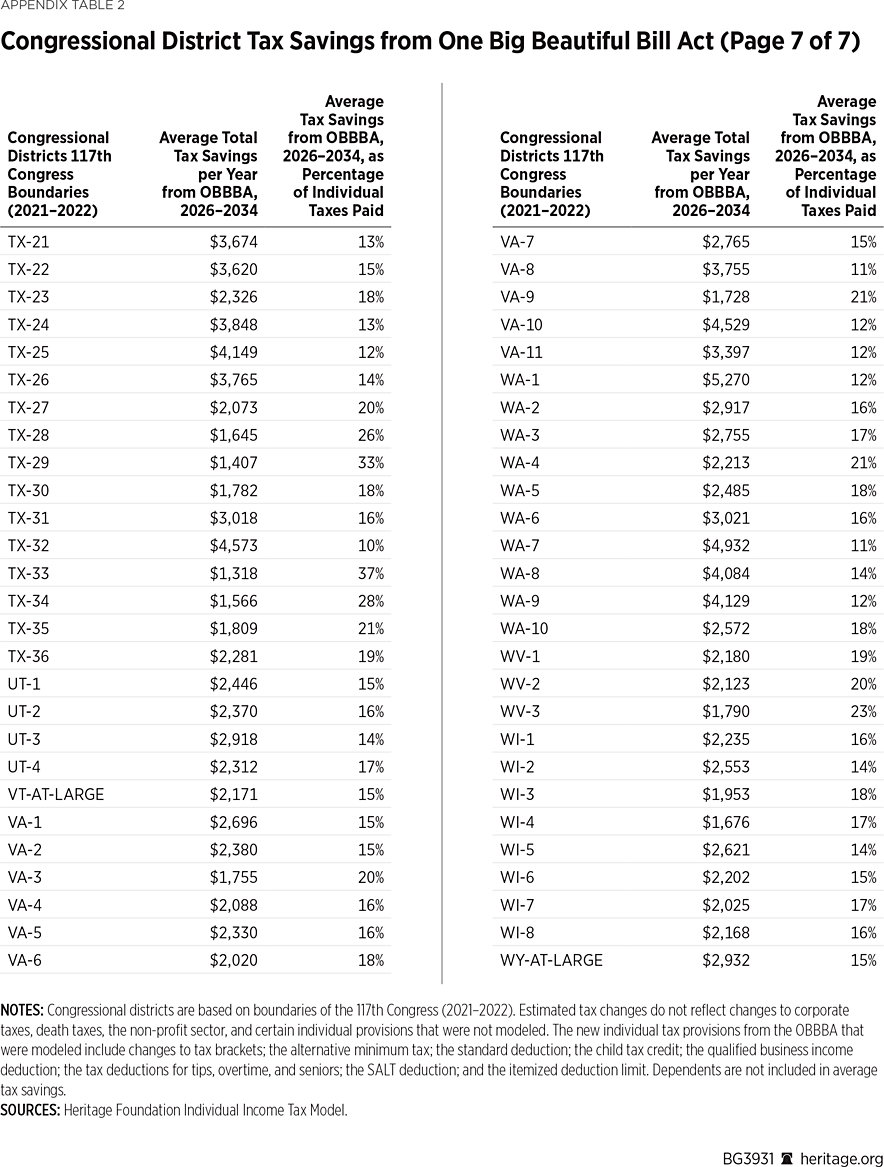
The HFIITM was augmented with IRS data to estimate tax savings by congressional district as in effect for the 117th Congress (2021–2022).REF Map 1 shows the total tax savings by congressional district, including both the extension of the TCJA and the new tax cuts.
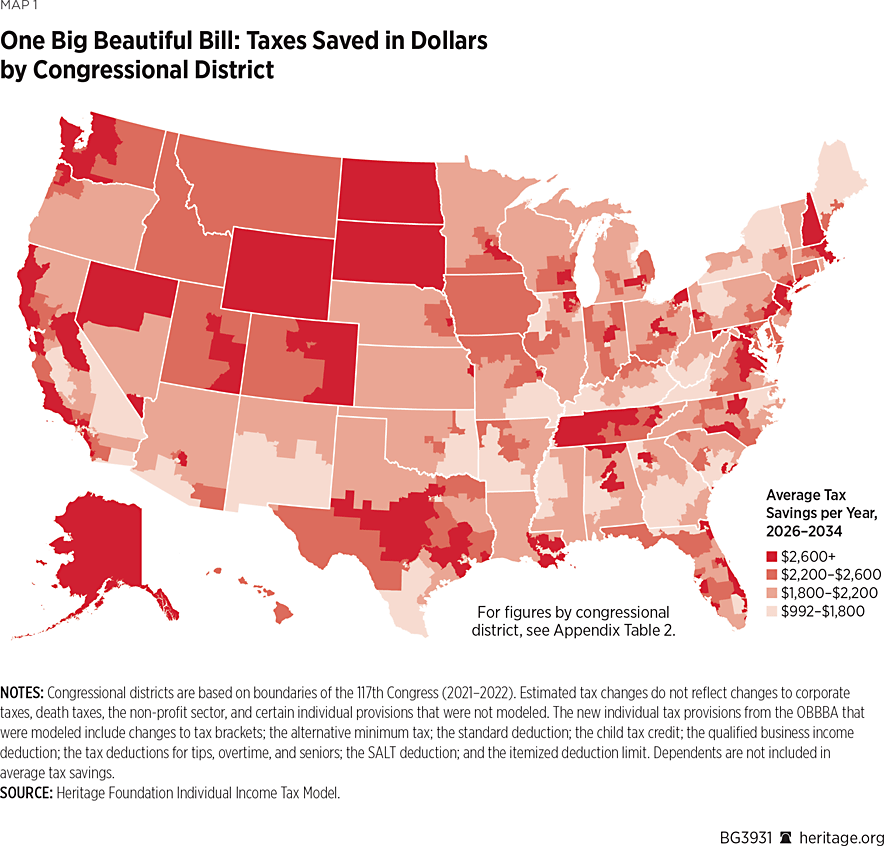
States redrew congressional district maps following the 2020 Census and the revised district maps went into effect for the 118th Congress (2023–2024), so the congressional district boundaries in the data and in Map 1 do not reflect current boundaries and do not include states’ newly gained or lost districts. In Tables 1 to 7 and Appendix Table 1, instead of presenting listings of the tax savings for 435 outdated district boundaries, the old district boundaries are grouped into areas that are more easily identifiable. These areas include approximations of the 50 most populous U.S. metropolitan areas. For metropolitan areas spanning multiple states, these alternative regional divisions do not include the parts of the metropolitan areas that are outside the state where the metropolitan area is centered.REF For states containing multiple congressional districts and one or more top 50 metropolitan areas, the rest of the state is classified as a single area. States with multiple congressional districts but no top 50 metropolitan area centered in the state are divided into two geographic halves (such as northern New Jersey and southern New Jersey) with roughly equal populations.REF For states with a single at-large congressional district, only the whole of the state is included as an area in the analysis.
There is some variation across different parts of the country in the amount of average tax savings, but the level of tax savings is consistently high throughout the country. In every state and in 96 percent of the areas within states, the average overall per-filer tax savings per year from extending the TCJA and the new tax cuts was more than $1,800.
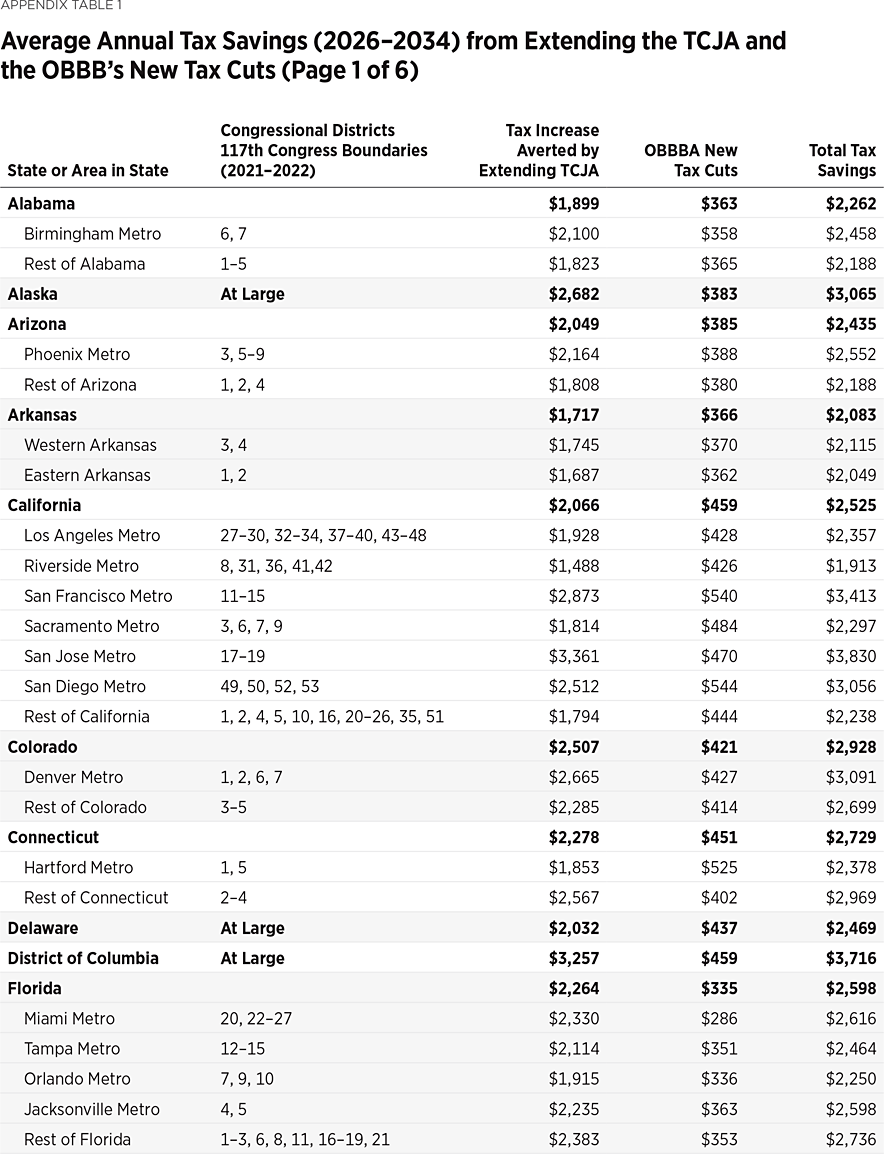
Appendix Table 1 describes these areas and the average federal income tax savings per non-dependent tax return under the OBBBA in each. The table separates the tax savings from preventing the expiration of the TCJA from the tax savings related to the new tax cuts.
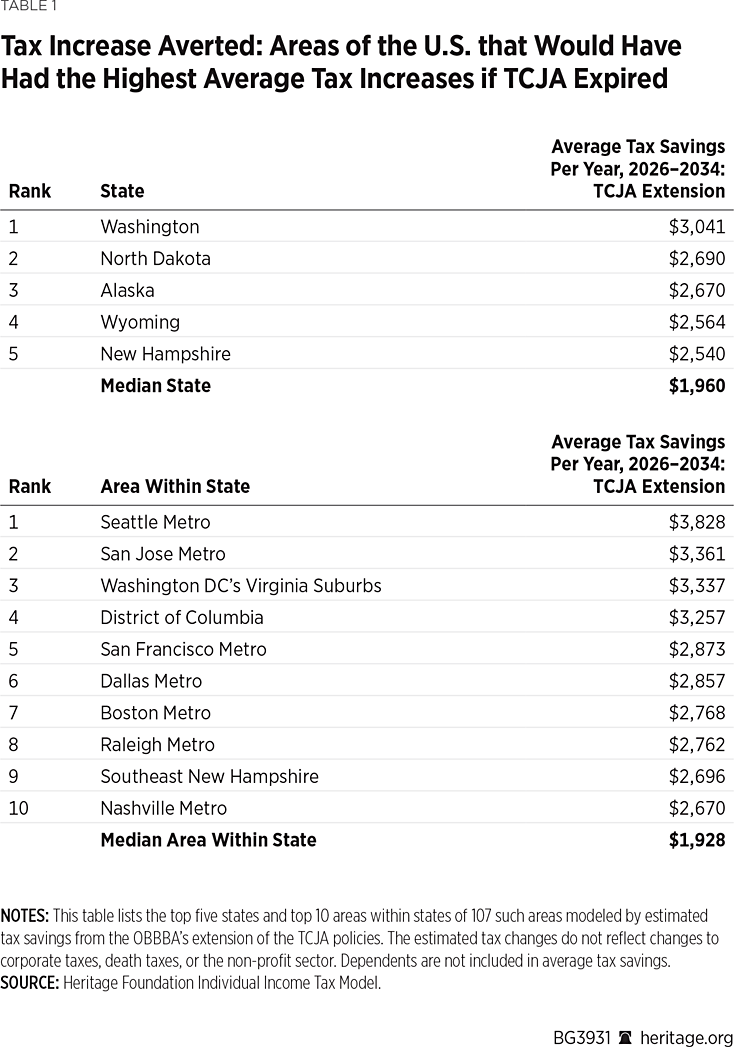
Preventing a Nationwide Tax Increase. Extending the expiring provisions of the TCJA prevents a large individual income tax increase throughout the country. Individual income taxes in every part of the country would have risen if Congress had not acted. Between 2026 and 2034, the average taxpayer in the median state would have faced an annual tax increase of $1,960 if the TCJA had expired. In every state and in 92 percent of the areas within states (as listed in Appendix Table 1), the average filer’s annual tax increase between 2026 and 2034 would have been more than $1,500 if the TCJA had expired.
Table 1 shows the five states and 10 areas within states that would have experienced the greatest tax increase had the TCJA’s provisions been allowed to expire. The extension of the TCJA will save the average taxpayer in Washington State and North Dakota $3,041 and $2,690 per year, respectively, between 2026 and 2034. Eight areas within states would have faced average tax increases of more than $2,700 had the TCJA expired, with the highest tax increase averted in the Seattle metropolitan area at $3,828. The areas that would have faced the highest tax increases upon expiration of the TCJA span all regions of the U.S. and include some of the least densely populated areas of the country (such as North Dakota and Alaska) and some of America’s larger metropolitan areas, such as San Francisco, the District of Columbia, Dallas, and Boston.
A Nationwide Individual Tax Cut. The OBBBA goes beyond preventing a tax increase: it also cuts individual income taxes in all parts of the country. In the median state, the average filer will pay $413 less in taxes than if Congress had simply extended the TCJA with no changes. In every state plus 97 percent of the areas within states, the average taxpayer will pay at least $330 per year less in taxes between 2026 and 2034 than under a simple TCJA extension.
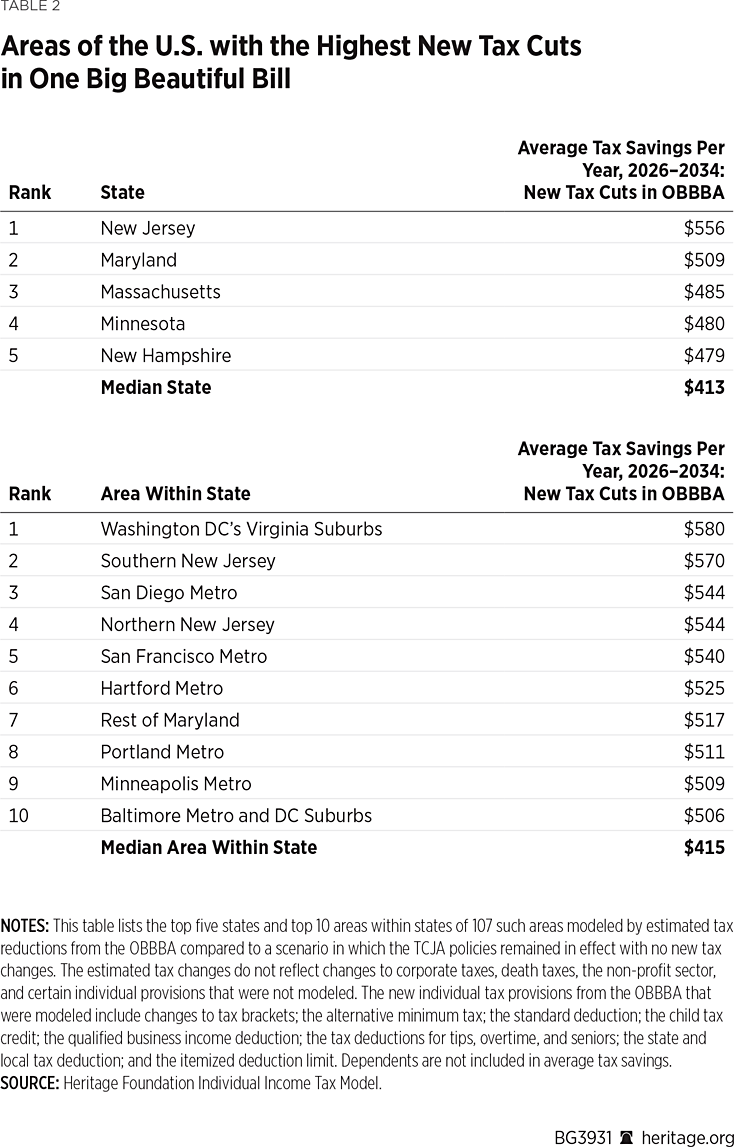
Table 2 shows the states and areas within states with the greatest tax savings from the new tax cuts in the OBBBA. The top states, New Jersey and Maryland, have average tax savings from the new tax cuts of $556 and $509, respectively. In each of the top 10 areas, the average non-dependent filer will receive a tax cut of more than $500 beyond the tax cut he would have received with a plain extension of the TCJA. These areas are mostly metropolitan areas in the Acela Corridor (between Washington, DC, and Boston) and the West Coast. As discussed further below, the above-average new tax cuts in these high-tax coastal cities and states largely stem from the OBBBA’s increase of the SALT deduction cap from the TCJA level of $10,000 to $40,000 in the tax years 2025 through 2029.
Overall Tax Savings from the One Big Beautiful Bill. As noted, average taxpayers in the median state will save approximately $2,401 per year from the OBBBA between new tax cuts and the tax increase they will avoid with the extension of the TCJA. The areas of the U.S. with the highest average overall tax savings from the OBBBA (as listed in Table 3) are almost identical to the areas of the U.S. that would have faced the highest average tax increase had the TCJA expired (as listed in Table 1). This near-complete overlap reflects that the primary driver of tax savings from the passage of the OBBBA is the extension of the TCJA.
The average filer in Washington State, North Dakota, and Alaska will have more than $3,000 per year in combined tax savings. The Seattle metropolitan area tops the list for highest average combined tax savings of areas within states. The average taxpayer in the Seattle metropolitan area will save about $4,287 per year between 2026 and 2034 ($3,828 of which is from the extension of the TCJA). In addition to Seattle, the 10 areas with the highest overall savings under the OBBBA include many other metropolitan areas that are among the highest in per capita income in the country, such as Boston, Denver, San Francisco, San Jose, and Washington, DC.
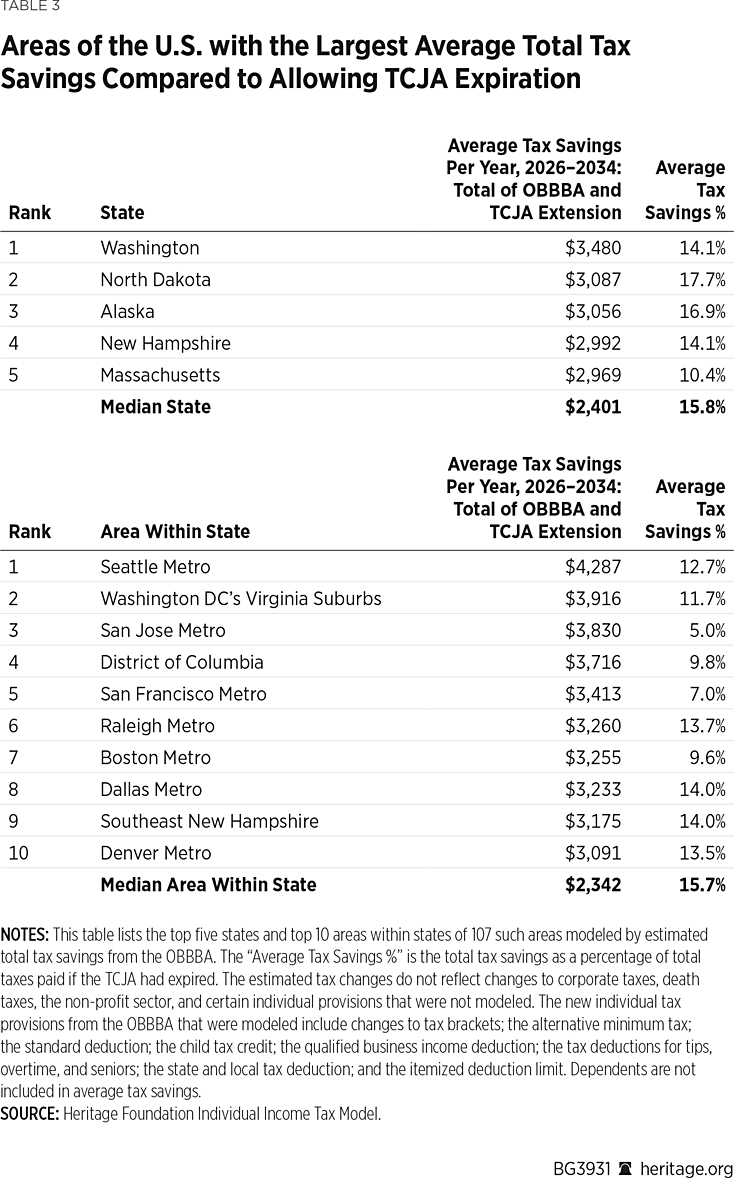
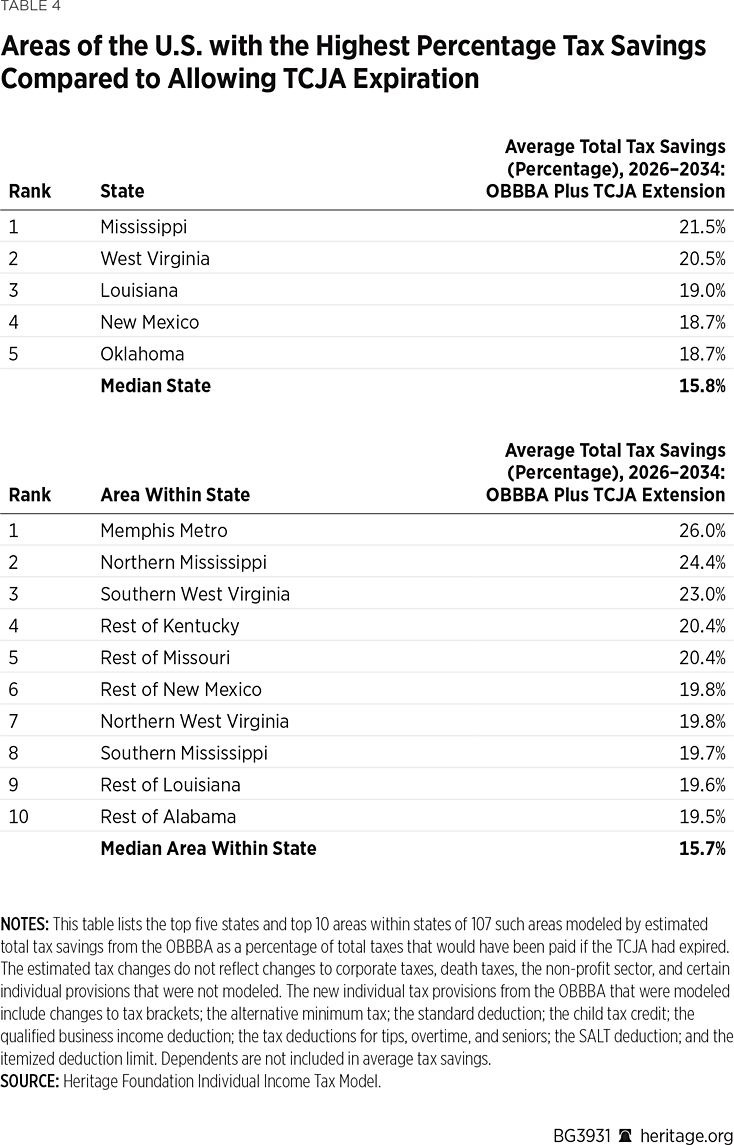
However, as Table 4 shows, the average taxpayer in lower-income areas will tend to save more in taxes as a percentage of taxes paid. While the average taxpayers in the median state will save about 15.8 percent of their taxes, the model estimates that taxpayers in and around Memphis, Tennessee, will save 26 percent more on a percentage basis than taxpayers in any other area of the country.REF Besides Memphis, the other places with the highest savings as a share of taxes paid are all states or areas within states where the real median household income is below the national median (Alabama, Kentucky, Louisiana, Mississippi, Missouri, New Mexico, Oklahoma, and West Virginia).REF
Tables 2 and 3 indicate a negative correlation between how many dollars typical taxpayers in an area will save and how much they will save as a percentage of the taxes they pay. This may seem counterintuitive, but it is consistent with how the TCJA and OBBBA tax cuts for individuals were designed. The tax cuts include provisions that significantly reduce the share of taxes paid by middle- and lower-income Americans, such as the expanded standard deduction and child tax credit and new tax deductions for tipped income and seniors. However, those tax cuts are balanced to an extent by general reductions in taxes (such as the reduced rates in the TCJA) that tend to result in larger dollar reductions in taxes among higher-income Americans who pay far more in taxes than the average middle-income taxpayer. Since the average American in the top 5 percent (by income) pays about 30 times more taxes than the average American in the bottom 95 percent, even a significantly smaller percentage reduction in taxes for higher-income individuals (or areas) may correspond to more dollars in tax savings.REF
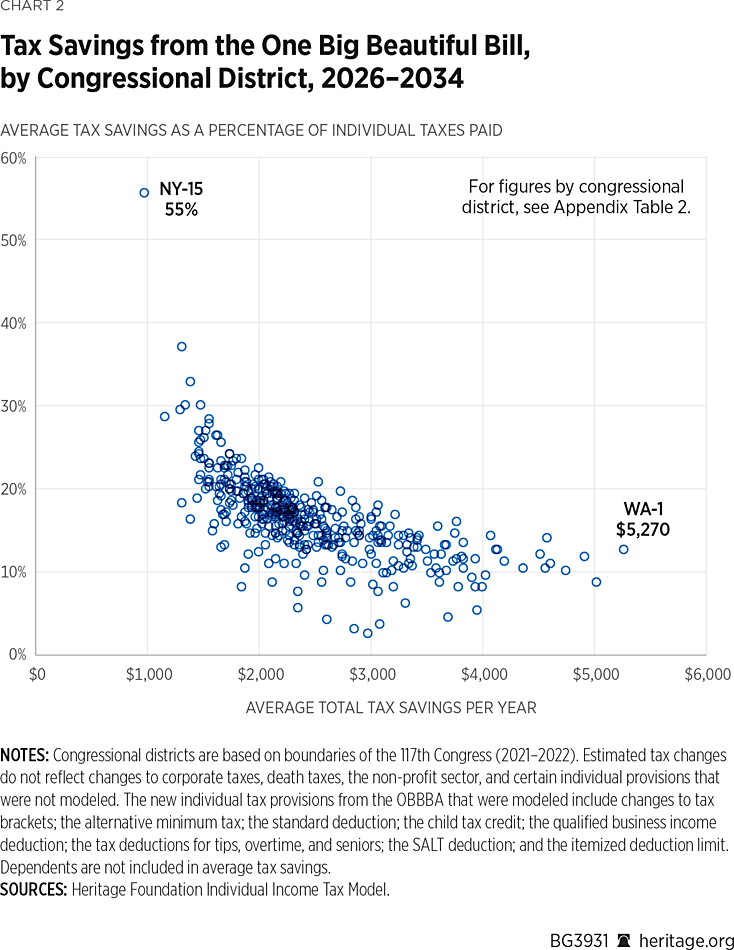
Beyond the areas shown in Tables 2 and 3, Chart 2 shows the inverse relationship between the tax savings (in dollars) of the average taxpayer in each of the 435 congressional districts (plus the District of Columbia) under the OBBBA versus their savings as a percentage of taxes paid. The correlation is –0.67. More than 80 percent of the congressional districts that are in the bottom half in tax savings as measured in dollars are in the top half in tax savings when measured on a percentage basis. Contrary to the notion that the tax cuts only benefit the rich, the tax cuts in the TCJA and OBBBA together will reduce the share of income taxes paid by relatively low-income taxpayers and congressional districts.
The Expansion of the State and Local Tax Deduction
The OBBBA reversed the TCJA in one key way: While the TCJA limited the amount of state and local taxes a taxpayer could deduct, the OBBBA quadrupled that amount, incentivizing states and localities to tax their residents more. The TCJA capped the SALT deduction at $10,000, but the OBBBA raised it to $40,000. The expanded SALT cap leads to very concentrated savings in a few states and localities with high taxes.
The Geographic Impact of the OBBBA’s SALT Deduction Expansion. The tax savings from the OBBBA’s new tax cuts (excluding the TCJA extension) are relatively balanced, geographically. From 2026 to 2034, the difference in average annual new tax reductions between the 10th and 90th percentile areas, $352 and $479, respectively, is small. These aggregated numbers, however, mask significant nuance and individual variation within those areas, including major differences in the effect of the expanded SALT cap.
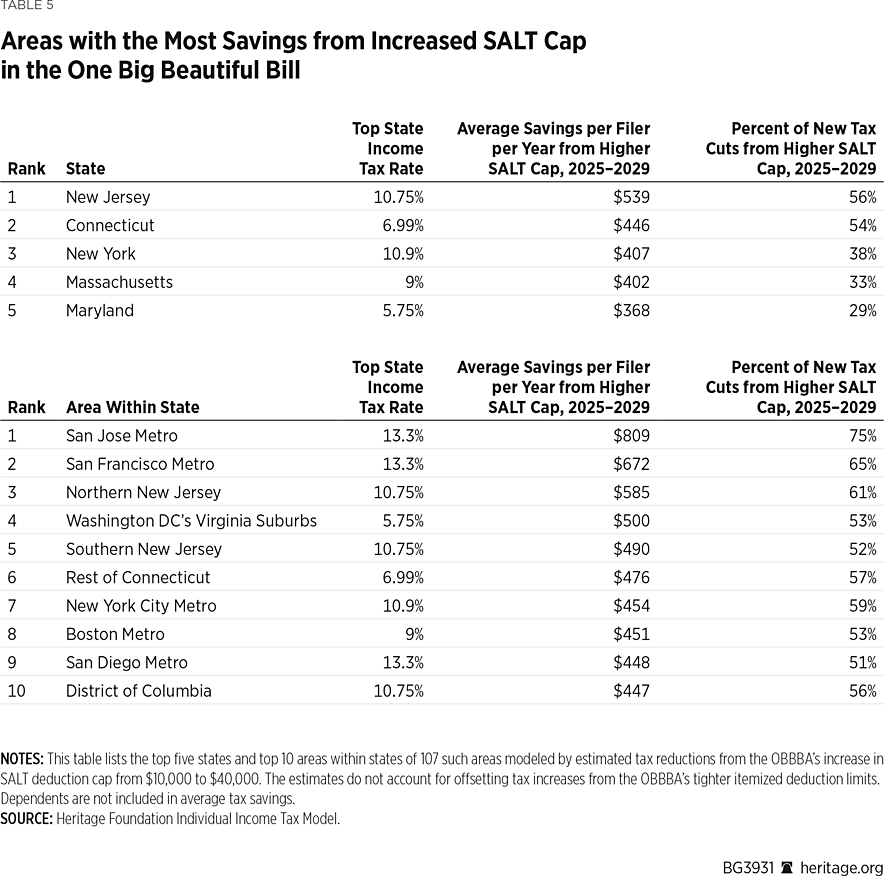
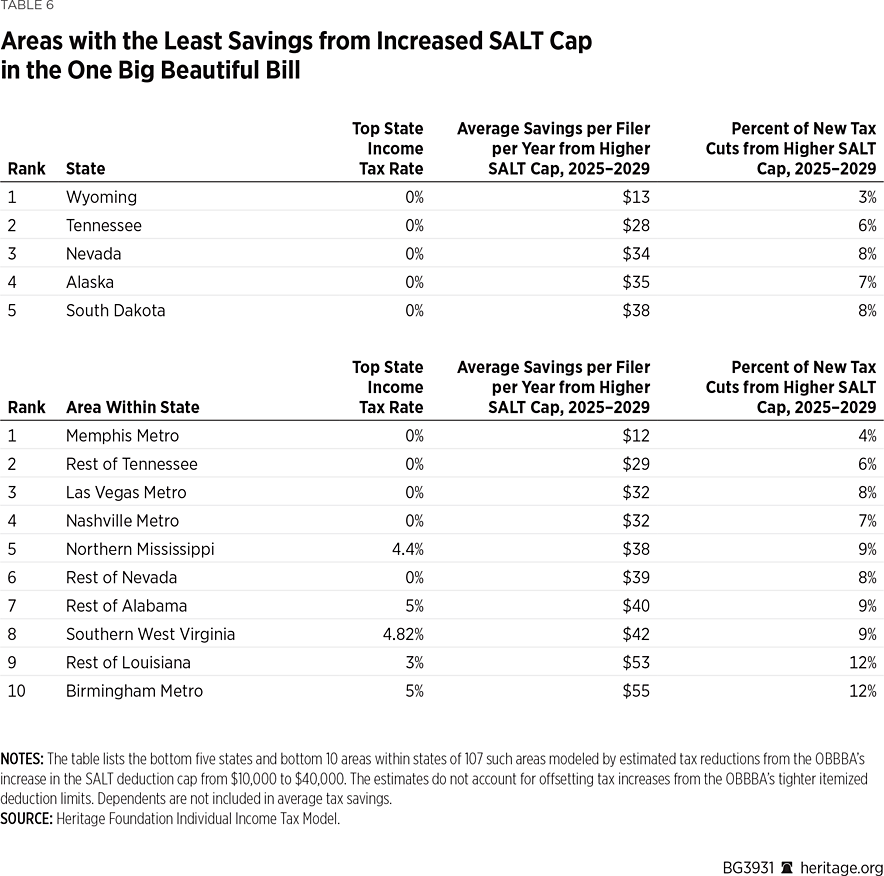
For some areas, the expanded SALT cap will be the primary driver of lower average taxes over the next five years (until the cap reverts to $10,000 after 2029), while the expanded SALT cap will have almost no impact in other areas. Table 5 shows that filers in the San Jose metropolitan area, the San Francisco metropolitan area, and northern New Jersey will have the greatest average tax savings from the higher SALT cap with 2025-to-2029 average annual tax cuts of about $809, $672, and $585, respectively. In contrast, the higher SALT cap will only reduce average annual taxes by $12, $13, and $28 in the Memphis metropolitan area, Wyoming, and Tennessee, respectively.
Indeed, most taxpayers will not save even one dollar from the higher SALT cap, because those who claim the standard deduction cannot itemize and claim the SALT deduction.REF In the years when the higher $40,000 SALT cap is in place (2025 to 2029), the HFIITM estimates that about 86 percent of Americans will claim the standard deduction. Of the remaining 14 percent of filers who do itemize, only a portion (about 64 percent) will benefit from the higher SALT cap, specifically itemizers who pay between $10,000 and $40,000 in income and property taxes, but who are below the income phaseout threshold ($500,000 to $600,000) for the higher SALT cap. In the years the higher SALT cap is in effect, it will reduce taxes for an average of about 9.1 percent of filers.
Increasing the SALT Cap: 2025–2029 vs. 2030–2034. The increase in the SALT cap is set to expire after 2029 and the new tax deductions for tips, overtime, and seniors would expire after 2028, so there are notable differences in tax savings between the first and second half of the 10-year period. The expiration of the quadrupled SALT cap will drive a large shift in which areas benefit the most from the new OBBBA tax cuts in 2025 to 2029 compared to 2030 to 2034 because of the provision’s size and the stark regional differences in its effects.
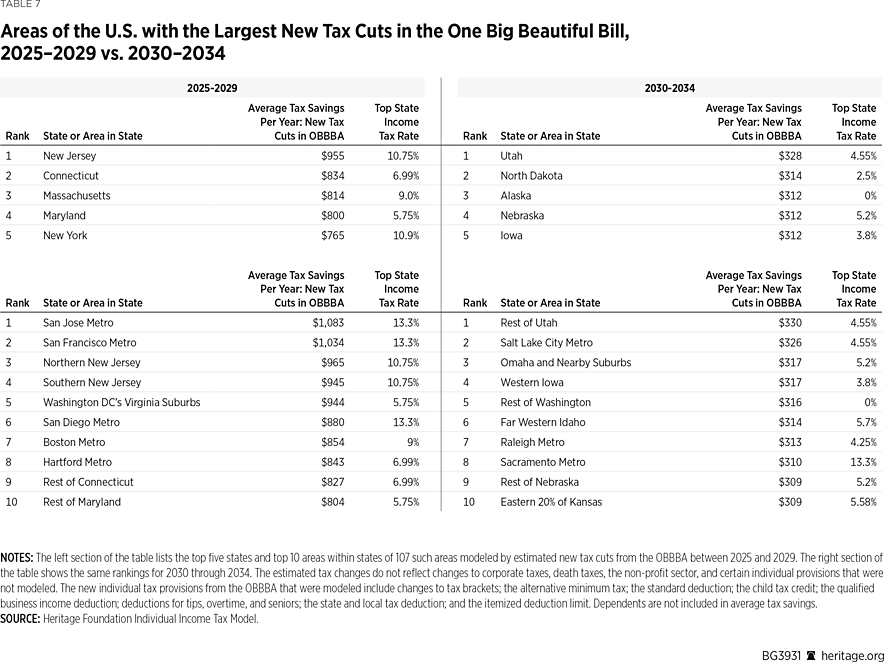
The left panel of Table 7 shows the five states and 10 areas within states with the highest average tax reduction from the OBBBA’s new tax cuts between 2025 and 2029. Each of them is a state or area within California or the Acela Corridor of the northeastern United States. The average top state income tax rate in these areas is more than 9 percent, roughly double that of the typical state.REF The average tax reduction in each of the top 10 areas is at least $215 higher than the median between 2025 and 2029.
The right panel of Table 7 shows the five states and 10 areas within states with the highest average tax reduction from the OBBBA’s new tax cuts between 2030 and 2034 (when the SALT cap is set to revert to $10,000). In contrast to the earlier five-year period, the OBBBA’s new tax cuts will result in a much more uniform reduction in taxes (in dollars) throughout the country between 2030 and 2034. The difference between the average tax reduction for the 10th-highest area and the median area between 2030 and 2034 is just $22 ($309 versus $287). While the regional differences in the tax reductions during these latter five years are small, it is notable that the largest tax savings are somewhat more concentrated in less densely populated areas away from the coasts. Most of these areas with the largest tax reductions will be significant beneficiaries of the OBBBA’s expanded child tax credit.REF
Discussion
Some have referred to the OBBBA as the largest tax cut in American history. Others, especially on the Left, have referred to its tax cuts as a “massive giveaway to the rich.” The first statement is arguably accurate when counting the continuation of the 2017 reforms and the new tax cuts, and if one does not consider the tax cuts relative to the size of the economy. The second statement, however, is a clear misrepresentation of reality.
Measured as a whole, including the extension of the TCJA, the OBBBA cuts taxes over a 10-year period by more than $4 trillion (on a static basis ignoring macroeconomic growth effects and including changes to corporate income taxes), making it the largest U.S. tax cut ever by that simple measure.REF However, relative to the size of the economy, the OBBBA tax cuts (including TCJA extension) are more typical of past tax reductions, representing about 1.2 percent of gross domestic product (GDP) over the 10-year period.REF For comparison, the Tax Foundation estimated that the 1981 Economic Recovery Tax Act and the Revenue Act of 1945 cut taxes by 2.9 percent and 2.7 percent of GDP, respectively.REF Still, the OBBBA will save the average filer a significant amount in taxes. Because of the OBBBA’s passage, the average filer will pay about $2,414 less per year in federal income taxes between 2026 and 2034 than if the TCJA had been allowed to expire. However, less than 20 percent of that reduction represents new tax cuts, while the rest is a continuation of the status quo tax policy.REF Therefore, from the perspective of everyday Americans—who notice how their own taxes change year to year but do not track tax law or changes to federal budget baselines—the OBBBA may seem modest, even though it prevented what would have been a historic peacetime tax increase.
Some have caricatured the tax cuts in the OBBBA as only benefiting the wealthy. A review of the provisions in the OBBBA’s tax provisions shows that most of the changes to the individual tax code lean more to the advantage of middle-income taxpayers, especially the new tax cuts. The bottom tax brackets were adjusted (favorably) while higher brackets were not. Tax deductions for tips, overtime, and seniors included explicit income phaseouts to ensure that high earners would not benefit. The expanded standard deduction is of little benefit to high-income taxpayers who itemize. The increase in the child tax credit reduces taxes for middle-income parents, but not for high-income parents, because it is subject to an income-based phaseout. These new tax cuts augmented the TCJA tax cuts, which had already resulted in a smaller share of taxes being paid by taxpayers in the middle and bottom of the income distribution.REF The geographic analysis above confirms the intuition that the tax cuts in the OBBBA were balanced to significantly reduce the taxes of middle-income Americans. The differences in tax savings between high-income and low-income areas are relatively modest, considering the sizable differences in taxes paid by high-income and low-income Americans. As a percentage of taxes paid, taxpayers in lower-income and middle-income areas will save the most.
The expanded SALT cap is the only major new tax cut in the OBBBA that leans toward higher-income taxpayers, though even the increased SALT cap includes an income-based phasedown between $500,000 and $600,000 of adjusted gross income. Other ways of cutting taxes for high earners, such as reducing capital gains taxes, would have been more economically beneficial than expanding SALT deductibility. The SALT deduction does little to nothing to improve productivity and reduce the economic distortions caused by taxation, but it does incentivize higher state and local taxes and spending.REF
Recommendations for Congress
Congress should build on the successes of the TCJA and OBBBA, mitigate the flaws, and implement policies that help to reinforce the United States as the best place in the world for businesses and entrepreneurs to invest and innovate. Congress should:
Repeal the SALT Deduction and the Municipal Bond Interest Exclusion. The SALT deduction should be eliminated entirely, but at a minimum Congress should not extend the $40,000 cap in 2029 when it is scheduled to expire. Relatedly, Congress should eliminate or phase out exclusions for municipal bond interest income. The SALT deduction and municipal bond exclusions incentivize expanded taxation and government spending. Because municipal bond interest is untaxed, it causes investors to demand higher interest rates on private-sector bonds and debt, raising borrowing costs for private businesses and individuals. Eliminating tax advantages related to public borrowing would help to improve private access to capital and would reinforce the TCJA and OBBBA’s encouragement of private domestic investment.
Offset the Repeal of SALT and Municipal Bond Exclusions with Reduced Taxes on Capital. Since the repeal of the SALT cap and municipal bond exclusion would disproportionately increase taxes in a few high-tax, high-income areas, Congress should consider pairing those repeals with tax cuts to capital income to avoid a net tax increase.
Follow Through with More Spending Cuts. The OBBBA included about $1.1 trillion in net spending reductions and cut about $500 billion in green energy subsidies in the tax code that act like spending programs.REF Congress also recently passed a $9 billion rescissions package. Congress should continue this trend. To ensure that the tax cuts are sustainable and to help keep interest rates down, Congress should follow these spending cuts with additional rescission packages, the codification of Department of Government Efficiency (DOGE) cuts, responsible limits to appropriations, and general fiscal restraint.
Deregulate and Focus on Growth and Stability. A key goal of the OBBBA was to increase economic growth, stability, and physical capital investments in the U.S. through, for example, the allowance of full and immediate expensing of equipment, machinery, and new factories. However, improving the tax treatment of investments will have a more limited effect if federal regulations stand in the way of those investments. Congress should work with the Administration to streamline federal permitting and regulations and to limit the ability of federal bureaucrats to stop or slow down new construction and industrial output.
Conclusion
Between the changes in the 2017 TCJA and the 2025 OBBBA, the federal income tax code in 2025 has undergone significant improvements. The 2017 tax reform brought business tax rates in line with those of the rest of the world, reduced double taxation that was harming U.S. companies trying to compete globally, and temporarily removed implicit penalties against companies that invest in new equipment and machinery. The TCJA also cut taxes nearly across the board for individuals and made major simplifications to individual taxes. The biggest shortcoming of the 2017 reforms and cuts was that so many of them were temporary. The temporary nature of many TCJA reforms ensured that 2025 would be a major inflection point for taxes as much of the legacy of the TCJA hung in the balance.
Among the OBBBA’s many achievements are that Congress reduced net federal spending by $1.1 trillion, cut $500 billion in subsidies to green energy companies, provided funding for border security, strengthened work requirements for certain welfare programs, and cut back on waste and abuse in the welfare system, such as benefits for illegal immigrants, among other changes.
However, no achievement was more important than making the remaining TCJA reforms permanent. The combined TCJA–OBBBA reforms are among the most important tax reforms in modern American history. The legislation does include a few less-than-ideal compromises that may frustrate conservatives, such as the temporary increase in the SALT cap. However, for many tens of millions of Americans, the OBBBA represents the difference between a large and unexpected tax hike and a welcome tax cut.
Preston Brashers is Research Fellow for Tax Policy in the Grover M. Hermann Center for the Federal Budget at The Heritage Foundation. Brian O’Quinn, PhD, is Computational Economist in the Center for Data Analysis at The Heritage Foundation.
Appendix 1: Tax Savings by Location
Appendix 2: Heritage Foundation Individual Income Tax Model Methodology
The estimates were produced by a custom microsimulation model, the Heritage Foundation Individual Income Tax Model (HFIITM), developed to analyze the federal individual income tax and reforms thereto.
The model starts with an IRS-produced sample of tax returns.REF For each observation in the sample, the program simulates the computation of taxes, much as if an actual person was filing a tax return. However, since the IRS dataset is censored and missing values, the model imputes information as needed to estimate a tax filer’s net income tax.
The IRS has ceased releasing these datasets. Thus, to study taxes over time, the model must generate a sequence of artificial samples to form the basis of tax return calculations beyond the original dataset year. This process—“evolution”—is governed by statistics, such as the total number of households filing jointly and the sum of reported wages.
For past years, these statistics are known and are provided by the IRS.REF For later years, these statistics are forecasted by the Congressional Budget Office as part of its baseline economic and tax projections.REF The TaxData project of the Policy Simulation Library compiles these amounts, and it is from there that most of the HFIITM’s statistics governing evolution are sourced.REF
The evolution process takes the original sample and modifies it, as conservatively as possible, such that it satisfies the specified statistics. The result is an artificial sample that captures observed or predicted trends while maintaining the heterogeneity present in the original sample.
The model then uses this artificial sample to calculate taxes for the sample’s year. The program cycles through these processes of evolution and tax calculation until it has simulated taxes for the 10-year budget window.
For the estimation of the cost of the OBBBA’s overtime provision, the HFIITM relies on a dataset produced by the Budget Lab at Yale that estimates the prevalence of overtime.REF That dataset is combined into the HFIITM’s sample using a method like the one the Budget Lab at Yale employs for its analysis.REF
The regional estimates presented in this Backgrounder are calculated using congressional district data provided by the IRS and are based on the districts for 2022. Congressional district samples are computed using a technique nearly identical to evolution as described above.