First things first, this is September data… so horribly lagged/stale… but, it’s all we have, so let’s dive in.
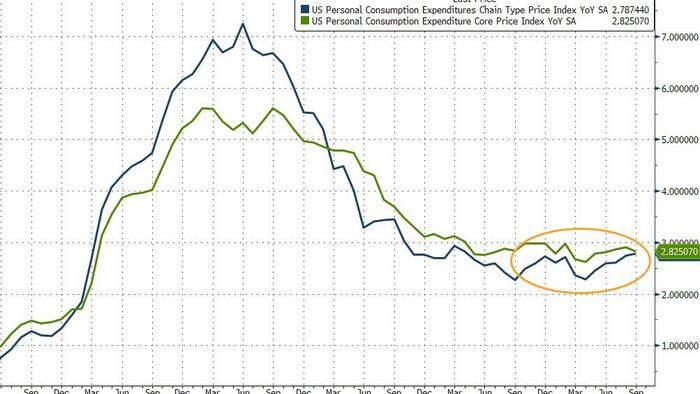
The Fed’s favorite inflation indicator – Core PCE – rose 0.2% MoM (as expected), which leave it up 2.8% YoY (as expected), slightly lower than August +2.9%…

Source: Bloomberg
On an annual basis, the headline PCE rose 2.8%, up modestly from 2.7% YoY in August (as expected). That is the highest since April 2024, but again remains in the range of the last two years…

Source: Bloomberg
…showing no signs at all of the runaway tariff-driven costs that so many establishment economists proclaimed was imminent.
Services costs (not tariff-related directly) attributed the most to the rising costs while Goods prices were barely positive…

Source: Bloomberg
The closely-watched SuperCore PCE slipped to +3.25% YoY…

Source: Bloomberg
Also trending lower overall, ruining the ‘Trump will kill us all with tariffs’ narrative.
Meanwhile, amid rising prices, income growth outpaced spending growth for a change…

Source: Bloomberg
Leaving the savings rate at 4.7%, unchanged from August and at lowest since Dec 2024…

So, while this data is admittedly stale, it shows no signs of 1) tariff-driven inflation or 2) a suffering consumer.
Loading recommendations…