This graphic, via Visual Capitalist’s Bruno Venditti, uses IRS data from 2022 analyzed by SmartAsset to show how much the richest people contribute to income tax revenue.

Where the Top 1% Pay the Largest Share of Taxes
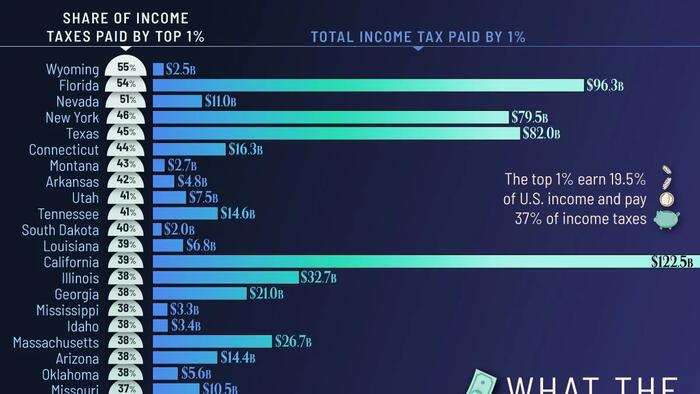
The table below includes each state’s share of income taxes paid by the top 1% and the total amount of income tax they paid.
Wyoming leads the nation, with the top 1% paying 54.67% of all state income taxes.
Florida and Nevada follow closely, both surpassing the 50% threshold.
These states attract high-income individuals in part due to tax-friendly policies and large concentrations of wealthy households.
| Rank | State | Income taxes paid by top 1% | Total income tax paid by 1% (thousands of dollars) |
|---|---|---|---|
| 1 | Wyoming | 54.67% | $2,460,940 |
| 2 | Florida | 53.62% | $96,264,565 |
| 3 | Nevada | 51.12% | $11,010,104 |
| 4 | New York | 46.26% | $79,488,609 |
| 5 | Texas | 44.52% | $81,990,700 |
| 6 | Connecticut | 43.85% | $16,284,881 |
| 7 | Montana | 42.92% | $2,690,156 |
| 8 | Arkansas | 42.22% | $4,814,153 |
| 9 | Utah | 41.16% | $7,477,634 |
| 10 | Tennessee | 41.04% | $14,547,566 |
| 11 | South Dakota | 40.46% | $2,020,508 |
| 12 | Louisiana | 38.72% | $6,806,423 |
| 13 | California | 38.60% | $122,452,981 |
| 14 | Illinois | 38.39% | $32,677,874 |
| 15 | Georgia | 38.31% | $21,001,340 |
| 16 | Mississippi | 38.29% | $3,297,109 |
| 17 | Idaho | 38.20% | $3,392,957 |
| 18 | Massachusetts | 38.19% | $26,646,912 |
| 19 | Arizona | 38.00% | $14,438,918 |
| 20 | Oklahoma | 37.80% | $5,622,529 |
| 21 | Missouri | 37.16% | $10,481,163 |
| 22 | South Carolina | 37.05% | $8,867,845 |
| 23 | Nebraska | 37.03% | $3,704,671 |
| 24 | Alabama | 36.15% | $6,778,809 |
| 25 | Kansas | 35.79% | $5,066,051 |
| 26 | Wisconsin | 35.54% | $11,024,109 |
| 27 | Indiana | 35.52% | $10,518,818 |
| 28 | New Hampshire | 35.41% | $3,946,877 |
| 29 | North Carolina | 35.28% | $19,037,365 |
| 30 | Pennsylvania | 35.09% | $26,128,752 |
| 31 | Michigan | 35.01% | $16,650,121 |
| 32 | Ohio | 34.60% | $18,842,538 |
| 33 | Colorado | 34.51% | $14,894,687 |
| 34 | North Dakota | 34.41% | $1,521,767 |
| 35 | Kentucky | 34.26% | $5,451,182 |
| 36 | New Jersey | 33.78% | $26,899,308 |
| 37 | Rhode Island | 33.58% | $2,150,700 |
| 38 | Hawaii | 33.57% | $2,455,554 |
| 39 | Iowa | 33.16% | $4,813,252 |
| 40 | Virginia | 32.94% | $19,239,261 |
| 41 | Minnesota | 32.64% | $11,524,941 |
| 42 | New Mexico | 32.30% | $2,380,544 |
| 43 | Washington | 32.06% | $20,012,467 |
| 44 | Vermont | 32.04% | $1,078,255 |
| 45 | Maine | 30.48% | $1,976,671 |
| 46 | Maryland | 30.45% | $12,675,749 |
| 47 | Delaware | 30.38% | $1,647,326 |
| 48 | Oregon | 30.37% | $6,773,041 |
| 49 | West Virginia | 30.28% | $1,647,747 |
| 50 | Alaska | 26.37% | $1,016,945 |
High-Population States with High-Dollar Contributions
In states like California, Texas, and New York, the share of taxes paid by the top 1% ranges from 39% to 46%, but the dollar amounts are higher due to population scale.
California’s top earners alone account for more than $122 billion in income taxes, the largest total contribution of any state.
High adjusted gross incomes—often above $2 million—mean that even moderate tax-share percentages translate into substantial revenue.
States with More Evenly Distributed Tax Burdens
States further down the ranking, such as Oklahoma, Arizona, and Idaho, still see the top 1% paying about 38% of income taxes.
Alaska sits at the bottom, with top earners paying 26%.
Across nearly every state, the top 1% shoulder between one-third and one-half of total income taxes.
If you enjoyed today’s post, check out Mean vs. Median: Visualizing Net Worth in the U.S. by Age Group on Voronoi, the new app from Visual Capitalist.
Loading recommendations…