
Donald Trump’s War on America’s $5.4 trillion of two-way trade with the rest of the planet is surely one of the most senseless acts of state aggression in modern times, if ever. That’s because its predicate—that America’s giant, unsustainable trade deficits are owing to unfair trade—is dead wrong.
And we do mean wrong—as in completely, unequivocally and with no if, ands or buts. Indeed, Trump thinks large trade deficits are prima facie evidence of cheating by our trading partners, yet the evidence debunks that primitive axiom with such alacrity as to literally shutdown the argument.
For instance, the Donald never stops bragging about his negotiating the USMCA in late 2018, which he claims was a vast improvement upon the existing three-way free trade arrangement between the US, Mexico and Canada known as NAFTA. In truth, of course, it was mainly a name change with some sops to the UAW and other American unions, which provided more stringent wage standards in Mexico. But the core feature—zero tariff trade between the three countries—was maintained.
Here’s the thing, however. During 2017—before the Donald’s new and improved USMCA— the US trade deficit with Mexico and Canada was -$65 billion, representing a modest 5.0% of total two-way trade of $1.298 trillion between the US and its two NAFTA partners. Self-evidently, that deficit was not caused by tariff barriers because, by definition, there weren’t any.
2017 NAFTA Trade:
- US Exports To NAFTA: $616 billion.
- US Imports From NAFTA: $681 billion.
- Trade Deficit With NAFTA: -$65 billion.
- Total Two-Way Trade: $1,298 billion.
- NAFTA deficit as % Of Two-Way Trade: 0%.
Fast forward to 2024 and you will see that the US combined deficit with Mexico and Canada has soared to $235 billion, and actually represented 14.6% of two-way trade which totaled $1.6 trillion with the two USMCA partners. So in a structural sense, the US trade deficit with its partners to the north and south significantly deteriorated.
That’s right. The Donald’s new and improved USMCA deal extended the zero-tariff approach of NAFTA and also added some additional features designed to remove so-called NTBs (nontariff barriers) by ensuring that Mexico’s labor and environmental standards didn’t give it any unfair trade advantages. In the case of wages, in fact, the USMCA’s Annex 23-A required Mexico to eliminate company controlled unions and raise wages by $4 to $6/hour by 2024.
Still, what happened on a completely level playing field over that seven year period is that US exports to the USMCA partners rose by 11% but imports soared by 35%, causing the trade deficit to expand by nearly four-fold. So either the Donald scored an own goal or this huge deficit with Mexico and Canada was caused by factors other than trade barriers and cheating partners.
2024 USMCA Trade:
- US Exports: $683 billion.
- US Imports: $919 billion.
- Trade Deficit With USMCA: –$235 billion.
- Total Two-Way Trade: $1,602 billion.
- USMCA Deficit as % of Total Trade: 6%.
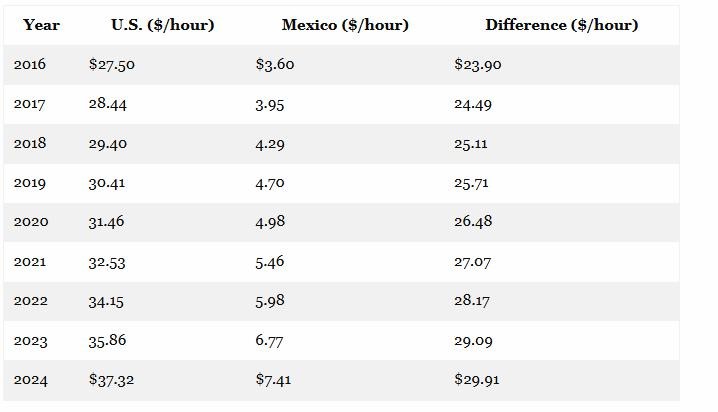
What didn’t remain level, of course, was the wage gap—especially as between US and Mexican manufacturing wages. Not surprisingly, the US trade deficit with Mexico alone rose from -$63 billion in 2016 to -$172 billion in 2024.
As shown in the table below, in fact, average hourly US manufacturing wages including payroll taxes, health care, pension funding and other fringes rose from $27.50 per hour in 2016 to $37.32 per hour in 2024. In turn, the wage gap with far lower hourly pay levels in Mexico increased from $23.90 in 2016 t0 $29.91.
So there is now a $30 per hour wage difference on either side of the Rio Grande. Accordingly, the Fed should have been deflating the US economy in recent years, attempting to wring out decades of cumulative inflation that was making US industry increasingly uncompetitive in global markets. The Donald was having none of that, however, given that he spent most of his first term berating the Fed for being too tight, and then demanded that it unleash the inflationary cyclone that hit the economy after he shut it down and then pumped households full of trillions of free stuff in 2020.
As it happened, therefore, the Fed’s dunderheaded pro-inflation policies caused average fully loaded manufacturing wages in the US to rise by nearly +36% during that eight year period, albeit to hardly any advantage at all to US factory workers. When adjusted for the rise in the CPI, average 2024 manufacturing wages of $24.55 per hour in base pay plus $12.77 per hour in payroll taxes and fringe benefits or $37.32 per hour total were only 4% higher than they had been in 2016.
Fully Loaded Manufacturing Hourly Wage Table (2016–2024)
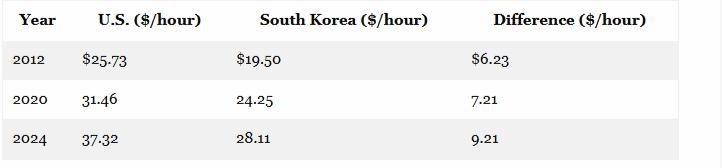
Needless to say, the USMCA story is not an aberration or exception; it’s actually the rule. Take the case of South Korea, which entered into a bilateral free trade agreement with the US in 2012 requiring the phase out of all industrial and agricultural tariffs over the next eight years. By 2020, therefore, tw0-way trade with South Korea was tariff-free with upwards of $200 billion of trade now crossing the borders of both sides without any import duties.
Yet in 2023, the US trade deficit with South Korea was huge, amounting to 27% of the total bilateral volume of imports and exports.
US/South Korea Trade In 2023:
- US Exports to South Korea: $66.6 billion.
- US Imports from South Korea: $116.0 billion.
- US Balance with Korea: -$49.4 billion.
- Trade Deficit as % of Two-Way Volume: 27.1%.
Again, the explanation for the huge US trade deficit is production costs, not tariffs or other trade barriers. During that 12 year interval fully loaded US hourly wages rose by 46%, while those for South Korea rose by nearly the same ratio, ticking higher by 45%. But it terms of dollars and cents on the cost sheet, the wage gap widened from $6.23 per hour when the South Korean free trade deal was signed in 2012 to $7.21 per hour when it became fully effective in 2020 to $9.21 per hour in 2024.
The Donald is always berating his predecessors for allegedly making bad trade deals, claiming that they have stupidly sent money and jobs abroad. Yet here is a solid free trade deal that produced one of the largest US bilateral trade deficits because all the while the Fed was inflating wages and costs in the US economy to increasingly uncompetitive levels.
Again, the Fed pro-inflation stance did precious little for the purchasing power of the workers’ paychecks. The 2024 US wage cost in inflation-adjusted dollars was up by only 3.4% from 2012 levels.
And that’s not the half of it. It turns out that nearly all of the real US labor cost gain during that period was due to payroll taxes and fringe benefit cost. The base hourly wage rate in worker pay envelopes, in fact, was $24.45 per hour in 2012 (2024 $) and $24.55 per hour in 2024. So the average US manufacturing worker gained just one thin dime per hour in real purchasing power over more than a decade!
Table: Fully Loaded Manufacturing Wage Costs (U.S. and South Korea)
To complete the story, the table below shows 2023 results for America’s Big Five Asian trading partners—China, South Korea, Taiwan, India and Vietnam— which account for the preponderant share of the America’s global trade deficit, and which bilateral balances are all heavily tilted in favor of imports.
But here’s the thing. In 2023, the average tariff on US exports to these five countries was 6.2%, while US tariffs on imports from the five averaged 10.6%, including 19.3% on goods purchased from China per the Donald first term tariffs. In dollar term, these five trading partners collected a modest $19 billion in duties from US shippers, while Washington collected $88 billion in tariffs on goods arriving from them at US ports.
In short, when it comes to monetary trade barriers Washington was the culprit, levying far more onerous duties on its partners than they levied on US exports. And yet and yet: The US trade deficit with these five leading Asian exporters was massive. The combined deficit of $522 billion in 2023 amounted to nearly 46% of the $1.143 trillion of two-way trade with these countries.
US Trade With Big Five Asian Exporters in 2023:
- US Exports: $311 billion.
- US Imports: $833 billion.
- Trade Deficit: -$522 billion.
- Total two-way volume: $1.143 trillion.
- Trade deficit % of two-way trade: 7%.
Next, consider the US trade balance with the EU-27 versus that for the UK. As it happens, tariff levels on both sides of the equation are low and essentially close enough to even for government work . In the case of the EU-27, the latter’s weighted average tariff on US exports is 2.7% while the US tariff on imports from the EU-27 is 2.0%. Likewise, the UK tariff on American exports is 3.8% versus the US average tariff of 2.0% on imports from the UK.
Then again, the trade balance outcomes are wholly dissimilar. In 2023, the US had a modest $3.3 billion surplus on combined two-way trade of $138 billion with the UK, whereas it ran a huge $221 billion deficit with the EU-27 on $931 billion of two-way trade. That is to say, when similar tariff policies are correlated with drastically opposite results on the Donald’s winners and losers scoreboard, the validity of the entire deficits-prove-unfair-trade axiom is surely called into question.
Needless to say, even when you include the EU-27 and the USMCA countries and all other significant trading partners from Brazil to Pakistan, Indonesia, Singapore and Saudi Arabia, the story is consistently the same. There are no tariff barriers to US trade that explain the massive deficits which now materialize year after year.
Below is the aggregated data for the 51 top US trading partners in 2023, which accounts for more than 90% of US global volume. But again, the average US tariff of 3.9% was considerably higher than the 2.1% average tariff levied by these 51 partners on US exports. For want of doubt, in fact, it might be noted that the US collected $112 billion in tariff revenue for these 51 nations compared to just $40 billion of duties levied on US exports to their markets.
Alas, America’s higher tariffs did not deliver a “win” on the Donald’s trade scoreboard. Far from it. The combined trade deficit with the top 51 US trading partners was a staggering $1.145 trillion!
You read that right. America’s $2.862 trillion of imports from these countries was 66% larger than its $1.717 trillion of exports to them. That is to say, the combined deficit was equal to fully 25% of two-way volume with countries that account for the preponderant share of world trade.
US Trade With Top 51 Global Trading Partners In 2023:
- US Exports:$1.717 trillion.
- US Imports: $2.862 trillion.
- Trade Balance: -$1.145 trillion.
- Total Two-Way Volume: $4.579 trillion.
- Deficit % Of Two-Way Volume: 0%.
Accordingly, tariff barriers have absolutely nothing to do with America’s giant trade deficits. And as we have indicated in previous posts, the claim that massive US deficits are actually due to non-monetary trade barriers and related cheating, or what are known as NTBs, is equally bogus. But, again, for want of doubt we went straight to the mother load of the NTB (nontariff barrier) case—-the claim that China’s red capitalists are the world champion NTB trade cheats.
To be clear, we eliminate from this analysis the whining from Wall Street and the Fortune 500 about allegedly onerous Chinese treatment of their direct investments and operations on the territory of the Red Ponzi itself. We are referring to items like forced partnerships with local Chinese companies involving technology sharing arrangements or sharp limitations on repatriation of profits.
Actually, there is a very simple answer to that complaint that does not require a global trade war or imposing hundreds of billions of tariff-taxes on domestic consumers and importers. To wit, don’t invest in China!
All of these supposedly onerous conditions for doing business in China are by no means secret or surprises after the fact. To the contrary, US companies invest in China because the think they can make money or that its serves larger global strategies.
Either way, Washington should not function as their concierge. Or, as the man famously said, capital should go where it is appreciated. And, besides, these issues have virtually nothing to do with the giant trade deficits that the Donald claims to be attempting to eliminate.
Instead, the claim is that one way or another foreign economies are rigged in favor of exports and local producers—to the detriment of US based competitors. The implication is that domestic macroeconomic policies are inherently unfair and are the real reason why expedients like the Donald’s Reciprocal Tariffs are needed to level the playing field.
In this respect, Treasury Secretary Bessent was loudly making this case during the past week. At at recent international forum he claimed effectively that China produces too much and consumes too little. That is to say, its core macroeconomic policies allegedly violate the maxim of Professor J.M Keynes that governments everywhere and always need to be stimulating consumption and spending because otherwise people will save their way into depression and poverty!
To be sure, we thought way back in 1981 that the Reagan Revolution had purged Keynes’ demand side fixation from at least the economic policy lexicon on the GOP side of the aisle. But, no, this latest wet-behind-the-ears Wall Streeter to stumble into the Treasury
Building is not missing a beat in championing the Keynesian gospel that is resident in its permanent bureaucracy.
“China’s current economic model is built on exporting its way out of its economic troubles. It’s an unsustainable model that is not only harming China, but the entire world. China needs to change. The country knows it needs to change.”
In fact, this is just plain malarkey—the same thing Ben Bernanke was peddling two decades ago when he bailed out Wall Street. It only has an air of faint plausibility because the standard national income and product accounts (NIPA) imply that China has a savings rate which dwarfs that of the US, and that somehow this communistic practice of saving too much accounts for the massive US trade deficits with China.
The real cause, of course, is the inflated production costs and wage levels in the US versus the dollar equivalent in China. As we demonstrated last week, since 1992 when Mr. Deng declared it glorious to be rich the US price level has risen by 131%. Not surprisingly, the American market soon became flooded with labor-intensive Chinese shirts, shoes, sheets, toys and furniture at first; and then electronics, iPads, iPhones and computers in an even greater flood as time went on and Chinese manufacturing moved up the value chain.
As we also indicated previously, the nominal wage gap in USD was already large in 1992, but has steadily expanded ever since. In fact, in nominal USD terms the US/China manufacturing wage gap of $16.50 per hour in 1992 has more than doubled to $34.25. The figures below for both countries were supplied by Grok 3 and include both hourly pay plus full-loaded benefits absorbed by employers.
Hourly Wages: US-China=Labor Gap:
- 1992: $16.80-$0.33=$16.50.
- 2007: $29.81-$1.36=$28.45.
- 2024: $43.46-9.35=$34.14
In short, the Fed has inflated its way into a flood of imports from China due to the $34/hour wage gap, not trade barriers or intellectual property theft or Secretary Bessent’s risible claim that 18-year old Chinese girls working their fingers to the bone in a Foxconn iPhone plant save too much!
For avoidance of doubt, we have enlisted Grok 3 in the dis-aggregation of the standard NIPA accounts for both countries. While these NIPA accounts have an inherent Keynesian bias, we have been able to separate the statistical wheat from the chaff in a way that clarifies exactly where China’s great big “savings rate” comes from, and that it has virtually no bearing on the bilateral trade deficit with the US.
The latter is a matter of the vast wage and cost gap shown above. Pure and simple. End of story.
To summarize Grok 3’s prodigious digging and sorting, we can say that 90% of the savings gap shown at the bottom of the table—savings of 6.4% of GDP for the US and 26.9% of GDP for China—is owing to factors that have virtually no bearing on trade. These include the following items in terms of basis points relative to the total 2,050 basis point difference in the aggregate savings rates of the two countries indicated at the bottom of the chart:
- Bigger US fiscal deficits: 200 basis points in favor of China because the commie government doesn’t borrow enough.
- More China central bank money printing: 550 basis points owing to the Keynesian delusion that central bank fiat credit amounts to “savings”.
- China’s current account surplus versus US deficit: 330 basis point owing to the fact that Bessent et. al. implicitly claim the cause and the effect are one and the same.
- Shadow savings in the form of illegal off-shoring of China business profits: 300 basis points owing to Chinese entrepreneurs attempting to stealthily protect their wealth from the long arm of Beijing.
- Apple Inc etc. repatriation of profits: 40 basis points of savings when Apple Inc. brings its sweatshop profits home.
- Phantom economic growth in China thru government fiddling with GDP data: 160 basis points.
- Higher errors and omissions in China NIPA accounts: 270 basis points or the equivalent of 42% of the US savings rate is attributable to the admitted errors and omissions in the China NIPA accounts.
- Subtotal, all of above items: 1,850 basis points.
- % of Total Savings Gap: 90%
In order to further debunk the myth that 18-year olds working 12 hour shifts in Apple’s Foxconn factories save too much, we also dis-aggregated the data on the household sector per se. The latter is always waived around by protectionist who suggest that Chinese workers are both underpaid and then forced to put all of their meager earnings into a saving accounts.
Actually, the household data is heavily distorted by the US Welfare State, which provides a population of 335 million about $4 trillion per year in transfer payments, ranging from social security to foods stamps and subsidized housing. This compares to just $1.7 trillion provided to a population of 1.41 billion by the Chicoms in Beijing. In per capita terms, the comparison is $12,000 in the US versus $1,200 per capita in China.
Communist China’s more impecunious approach to welfare, of course, is a matter of government policy and can hardly be said to be a sinister plot to cheat on trade with the US. But it does tend to distort the household savings statistics because transfer payment recipients in both countries tend to live hand-t0-mouth and do not have the luxury to “save”.
The same distortion results from the inclusion of “imputed rent” in the income and spending statistics. The convention is that homeowners pay rent to themselves—with the payment charged to PCE (personal consumption expenditure) and the rental income allocated to interest income of households. However, since the two figures are a wash, the implicit savings rate is zero on what amounts to $1.8 trillion of US household “income” per year. By contrast, this phantom housing expense and income in the China NIPA statistics is only $200 billion per year.
In any event to get to an apples-to-apples comparison, we took the zero savings income and expense pairs for both transfer payments and imputed housing rent out of the data. That’s because they wash to zero anyway—even though in the case of the US household income statistics these two items total $5.8 trillion of “income”, which by definition can’t be saved because it is 100% off-set by expense.
The bottom line is clear: The true comparison of the household savings rate between the US and China is 7.3% of GDP for the former versus 11.9% for the latter per the first line of the table below. That 460 basis point difference is both minor in the great scheme of a $30 trillion versus $18 trillion economy, but is readily explained by the fact capitalist America has a prodigious Welfare State and Communist China does not.
So households save modestly more in China because they know the government isn’t doing it for them with a massive social insurance Ponzi Scheme like America’s soon to be bankrupt Social Security system. And yet, Secy Bessent says that its China that is cheating?!
In short, the “excess savings” canard is just beltway bullshit. It’s the go-to excuse of protectionists, and the hoary myth invented by Bubbles Ben Bernanke himself to obfuscate the trade disaster that the Fed has brought down upon America’s industrial economy.
And now the Donald and his clueless Treasury Secretary have apparently embraced this nonsense hook, line and sinker. Then again, when the entire case for “big beautiful tariffs” is 100% bogus, it’s not surprising that its advocates have become a fount of pure humbug.
Breakdown of US Versus China Savings Rate In 2023 By Major Component:
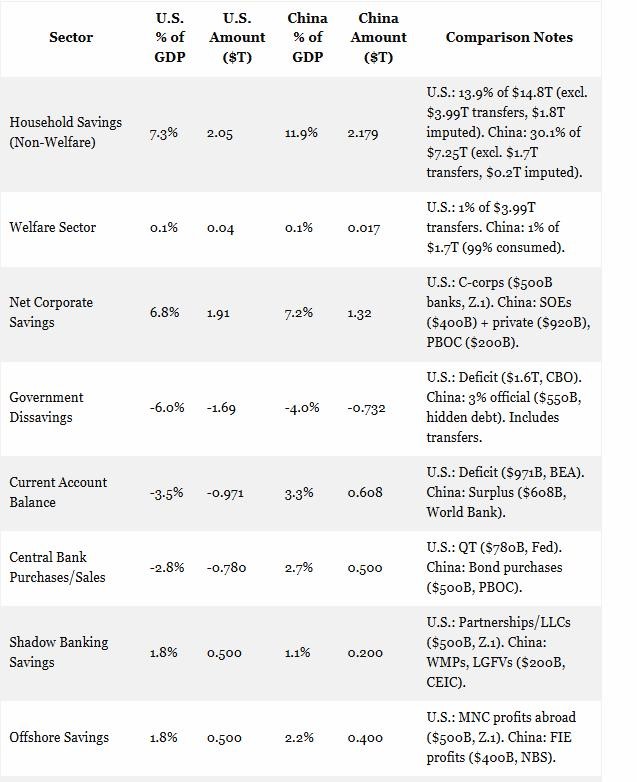
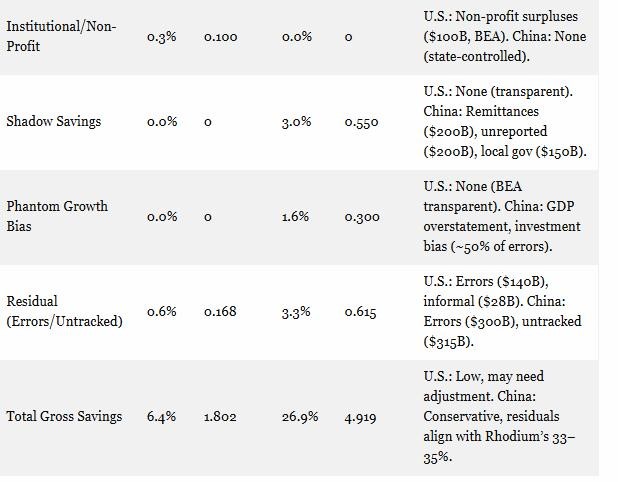
Table Notes:
US.:
- Household savings: $2.05T (7.3%), excludes transfers ($3.99T) and imputed housing ($1.8T), aligning with cash-flow focus.
- Residual: $168B (0.6%), includes informal economy ($28B), small due to BEA transparency.
China:
- Household savings: $2.179T (11.9%), excludes transfers ($1.7T) and imputed housing ($0.2T), closer to Rhodium’s ~14% discretionary savings.
- Residual: $615B (3.3%, errors $300B, untracked $315B), reduced by $300B phantom growth bias (1.6%, GDP/investment overstatement).
Reprinted with permission from David Stockton’s Contra Corner.


