IN THIS ISSUE:
- Reliable Solar Has Larger Land Footprint Than Previously Thought
- No Significant Change in European Flooding
- China and India Keep Adding Coal
Reliable Solar Has Larger Land Footprint Than Previously Thought
In comparison with traditional electric power generating sources, such as coal, natural gas, nuclear, and hydroelectric, solar power has a tremendous land footprint per amount of electricity generated.
In general, as discussed in “Energy at a Glance: Solar Power” and “Affordable, Reliable, and Clean: An Objective Scorecard to Assess Competing Energy Sources,” research shows solar power requires more than three times as much land per megawatt of electricity produced than coal, natural gas, or nuclear. That’s three times more habitat disrupted or farmland taken out productive use for crop or livestock output, than other sources of power, under an apples-to-apples comparison that includes mining but may exclude waste disposal for solar, which isn’t usually accounted for in most analyses.
However, a recent study by the energy analysts at “Energy Bad Boys,” Isaac Orr and Mitch Rolling, suggests solar power’s land footprint is much larger than previously believed, and it gets worse as more solar is added to an area to replace existing coal or if natural gas is excluded as an alternative for increased power needs.
Framing their analysis, Orr and Rolling write,
Most public discussions about solar focus on energy production, but power systems are built around reliability during peak demand. Once you look at the grid through the lens of accredited capacity—that is, capacity that can be relied upon during peak demand—instead of annual energy, the land requirements for different technologies look radically different.
Orr and Rolling compared the land impact of a proposed 500-megawatt (MW) solar facility, the River City Energy Project, in Cerro Gordo County, Iowa, to an alternative combined-cycle natural gas facility.
The existing Emery Generating Station natural gas plant in Cerro Gordo County has a rated capacity of 602.8 MW. Looking at a “comparable” solar complex through the lens of accredited or peak capacity demanded over extended periods, Orr and Rolling calculated it would require more than 105,792 acres of solar panels, roughly 29 percent of the total land area of Cerro Gordo County. That’s far above the 2,894 acres planned for the project based on average capacity.
Just looking at installed capacity, the proposed 500 MW Ranger Power industrial solar facility proposed for Cerro Gordo County would require approximately 5.8 acres per MW of rated installed capacity. By contrast, the existing gas plant sits on approximately 0.096 acres per MW of installed capacity. Hence, solar requires about 60 times more land per MW of power produced. And of course that’s just counting installed capacity, not accredited or necessary peak load capacity.
The Midcontinent Independent System Operator (MISO), the regional transmission authority and market-clearing wholesaler in which Cerro Gordo County falls, recently updated its power rating system to reflect the reliability of all generating sources across its system during periods where the system is most likely to experience loss of load hours. Under its new Direct Loss of Load rating system, MISO concludes that by 2030 during the summer peak expected reliable solar power across its territory would amount to approximately 4 percent of the needed power, falling to just 2 percent by 2043, less than halfway through the expected operational life of a new power facility brought online. Over the course of the year, the numbers are even worse, with MISO estimating solar facilities will provide just 2.25 percent of accredited power, and less than 1 percent in 2043, far less than the 50 percent MISO estimated under its prior rating system.
By comparison, MISO anticipates natural gas facilities during the same periods, summer peak and annual, will produce 89 percent of accredited power during the summer in 2030, falling to 88 percent by 2043, and 82 percent on average across the entire year in 2030, falling to 81 percent in 2043. Natural gas is simply much more, massively more, reliable than solar power during peak demand periods, keeping in mind that solar falls off entirely at night and produces much less power than rated when it is cloudy, raining, or snowing.
With MISO’s new accreditation system in mind, to provide comparable power to a proposed 500 MW natural gas alternative would require many more acres than proponents of the River City Energy Project solar facility estimate.
Under MISO’s rating system, “19.29 acres of solar panels would be necessary for one MW of accredited capacity in the 2025-2026 planning year, compared to 0.14 acres for a combined cycle natural gas plant,” Orr and Rolling estimate.
“In 2030 and 2033, it would require 257.24 acres of solar panels for one MW of accredited capacity, growing to 578.80 acres in 2043,” the Energy Bad Boys continue. “In comparison, natural gas would require 0.14 acres, 0.14, and 0.14 acres in 2030, 2033, and 2043, respectively.”
That means the solar facility would require nearly 1,838 percent more acreage to produce the same amount of reliable power as a gas plant.
The researchers expanded their analysis to Iowa as a whole. The table below tells the tale:
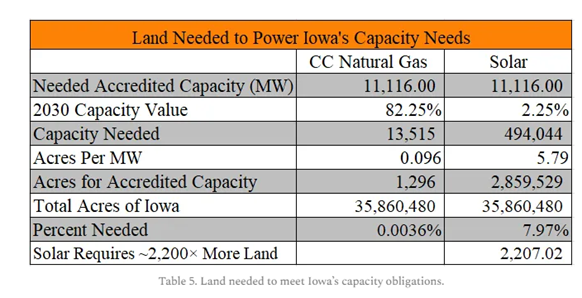
Elsewhere, these numbers will vary a bit based on geographic location and climate. New Mexico and Arizona get more sun annually than Iowa, after all. However, it won’t make a huge difference, because peak demand is higher in the sunnier and hotter states. Also, the performance of solar panels drops off considerably during periods of extreme heat. Solar panels experience a 0.30 to 0.50 percent efficiency loss for every degree Celsius above 77℉, amounting to a decline of 10 to 25 percent of their efficiency during extended periods of extreme heat.
The latter point is important because if ongoing climate change causes more extremely hot days and increased numbers of extended heat waves in the future, as climate models have projected—although experience and data have not borne this prediction out so far—then solar energy, one supposed solution to power modern society faced with a changing climate, will be less effective than promised. The more the Earth warms, specifically the higher the number of very hot days, the less effective solar energy is as a climate solution. Electricity providers have to add more and more panels, and thus cover more and more wildland and farmland with them, to make up for the efficiency losses solar experiences as temperatures exceed 77℉, which really is not that hot.
In short, regardless of whether one considers only the stated rated capacity or includes the more important accredited capacity, anyone who cares about land conservation and open spaces should reject new solar when considering how to satisfy the growing demand for steady electric power.
Sources: Energy Bad Boys;Energy at a Glance

No Significant Change in European Flooding
The Climate Cosmos website recently published an article debunking claims that Europe’s recent headline-making floods are historically unprecedented and proof of climate change.
Climate Cosmos is a German-owned a media platform that focuses on climate change, renewable energy, sustainability efforts, and space science.
In “European Floods and Storms Defy Claims of Climate Change Amplification,” writer Jeff Morgan examines media claims that climate change amplified flooding in parts of Europe, making the flooding more severe or more likely, with some outlets claiming the flooding was unprecedented. Morgan details historic and contemporary evidence showing the recent floods were neither unprecedented nor more extreme than past floods that occurred when global average temperatures and carbon dioxide emissions were lower than today. Morgan writes,
Long-term data reveal that major floods across Europe have occurred repeatedly throughout history, often rivaling or exceeding recent incidents in scale. For instance, the Danube River experienced devastating floods in 1997 that surpassed many contemporary events in severity.
Records from cities like Budapest and Vienna document significant inundations dating back centuries, including a notable event in 1838. These historical precedents indicate that extreme weather has long been part of the continent’s climate variability. Current analyses confirm no overall increase in the number of major floods in natural rivers over the past 80 years.
The Intergovernmental Panel on Climate Change’s Sixth Assessment Report provides clear evidence against rising trends in heavy precipitation or pluvial flooding events. Chapter 12 explicitly states no observed increase in such phenomena, even under moderate warming scenarios.
Projections for potential changes only emerge in highly speculative, extreme future scenarios beyond 2050, and those carry only medium confidence levels. This assessment underscores that observed European weather extremes do not show a clear upward trajectory tied to temperature rises.
In an unusual twist for a media outlet, Morgan’s article is footnoted, bolstering his claims with references.
The Heartland Institute’s Climate Realism website previously responded to earlier media claims about European flooding, noting the historical antecedents of the present flooding and the lack of discernible trends in increased flood severity or frequency.
Of course, the fact that floods of the past were at least as severe as recent floods and certainly deadlier doesn’t prove climate change has not played some role in present flood events. However, it does suggest flooding is more complex than the simple “climate change is happening, so climate change did it” attribution media outlets regularly make based on woefully biased and flawed rapid-attribution reports put out by climate activist organizations.
“Urban development and flood management practices play larger roles in determining damage from storms than any purported climate signal,” writes Morgan. “Regions with robust infrastructure investments weathered recent events far better than those without.”
Climate Realism has previously made the same point. Cities have grown dramatically with the rise of suburban areas, massive population growth, and a shift from rural areas and farming to industrial and commercial activity centered along historic transportation routes—rivers, streams, and ports. More people and more structures in areas prone to flooding means when floods come, damage, or at least the nominal value of damage, is greater than during previous floods. Better-hardened infrastructure can only make up for a fraction of the effect of poor planning and siting of homes and businesses. In the end, as Morgan details, the evidence that human greenhouse gas emissions are causing unusual flooding in Europe is not supported by historical evidence or contemporary analyses and trends.
Sources: Climate Cosmos; Climate Realism; Climate Realism

China and India Keep Adding Coal
China is the largest greenhouse gas emitter in the world, creating more CO2 than the United States, Canada, and the EU combined. India is the third-largest source of greenhouse gas emissions. With their stated commitment to climate action, one might be surprised to find they are still increasing their electric power production through coal-fueled power plants and plan to continue doing so for the foreseeable future.
A Global Energy Monitor report compiled by the Centre for Research on Energy and Clean Air states China’s coal build-out reached a new high in 2026, adding more than 1 GW of coal power each week. The numbers tell the story of China’s continued championing of coal:
- 78 GW of newly commissioned coal power capacity, resulting in China commissioning more new coal in 2026 alone than India’s net coal power capacity increase over the ten-year period from 2015 through 2024;
- 161 GW of newly proposed or reactivated coal units, the highest number on record and 13 percent of the current operational capacity;
- 83 GW of coal started construction; and
- 291 GW in the pipeline, equal to 23 percent of today’s operational capacity.
India, although far behind China in coal use, is rapidly industrializing, and coal power is central to its growth plans. India expects to add between 10 and 15 GW of new coal power in the 2025-2026 fiscal year. Despite stated goals of a coal decline by 2070, Reuters reports India’s use of coal is expected to more than double from 1.26 billion metric tons burned annually today to
2.62 billion metric tons in 2050. Although Ember Energy describes India’s use of coal as diminishing, the numbers tell a different story:
- roughly 32,000 MW to 35 GW of new supercritical (SC) and ultra-supercritical (USC) coal plants are currently under construction across 25 projects;
- India aims to increase its coal power capacity from about 217 GW (as of Aug 2025) to 307 GW by 2035, necessitating further projects to be signed off; and
- approximately 95 units totaling 56,605 MW are in various stages of the pipeline.
It is true both India and China are adding wind and solar at a rapid pace, but that is alongside new coal, not in lieu of it. That is unsurprising because intermittency requires that every megawatt of so-called clean power be backed up by approximately the same amount of reliable power, with coal filling that bill most often in China and India.
One should draw one’s own conclusions about the depth of China’s and India’s commitments to fighting climate change and, if one believes emissions are driving climate change, whether their current, heavily coal-dependent energy development paths are consistent with a serious attempt to prevent future warming.
Sources: Global Energy Monitor; Reuters