
Executive Summary
Illegally manufactured fentanyl (IMF) kills enormous numbers of people in the U.S. and Canada. Since the emergence of modern heroin markets in the late 1960s, supply control has been associated with meaningful reductions in opioid use and harms in at least six cases worldwide. However, countering supply effectively depends on understanding what the dominant drug-trafficking routes are. New data on fentanyl seizures presented here largely reinforce previous understanding that most IMF enters the U.S. from the south. These data call into question tariffs and other policies and policy justifications that treat the threat from the northern border as comparably severe.
U.S. counties bordering Mexico and Canada show significantly higher rates of large fentanyl seizures, compared with counties that do not border our foreign neighbors—where “large” is defined as over a kilogram of powder or more than 1,000 pills, quantities indicative of wholesale trafficking. The 80 counties along the land borders recorded 2,461 large seizures between 2013 and 2024, averaging about 31 per county, while the other 3,064 counties documented 12,358 seizures, averaging only 4 per county. By weight, of all the fentanyl in those big land-border seizures in 2013–24, about 99% of the pills and 97% of the powder were found along the border with Mexico; by comparison, large seizures along the Canadian border are relatively rare. If we look at the recent years—2023 and 2024—distributions remain the same. San Diego County, California, leads in powder-form large fentanyl seizures; and Pima County, Arizona, records the highest volume of pill-form large fentanyl seizures.
Smart Policy, Straight to You
Don’t miss the newsletters from MI and City Journal
Drugs seized could be in transit to other places, or they might be intended for local consumption. Therefore, it is useful to contrast a county’s share of large seizures with its share of the population, which serves as a proxy for the size of the local market. Counties along the Mexican border account for only 2.35% of the U.S. population; but in 2023–24, they hosted about 40% of the nationwide quantity of fentanyl appearing in large seizures, for both powder and pills. By contrast, counties in the lower 48 states that border Canada account for 3.1% of the U.S. population but only 1.2% of the powder and just 0.5% of the pills obtained in large seizures.
To determine which counties look like import or transit centers, we developed a Disproportionality Index (DI), which compares a county’s proportion of large seizures against its proportion of the national population. On that scale, 1.0 means that seizures are proportionate to local population; below 1.0 indicates less than expected; and over 1.0 indicates more seizures than expected. Because of random fluctuations, a county can be a bit above or below 1.0, but we consider DIs above 2.5 noteworthy.
The counties with the highest DIs for 2023–24 were along the U.S.–Mexican border. For example, Imperial County, California, had a DI of 111 for fentanyl pills and 100 for powder. In contrast, in the county along the Canadian border with the greatest number of large seizures (Wayne County, Michigan, home of Detroit), the DIs were 0.5 for pills and 1.9 for powder, yielding an average DI of less than 2.0.
Only three other counties or collections of counties along the Canadian border had an average DI greater than 1. One (Okanagan County, Washington) stemmed from drugs seized from a Mexican-led organized-crime group that was supplying populations near the Canadian border. Another cluster (Juneau and Ketchikan) was suggestive of Alaska markets possibly being supplied from Canada. The third (Whatcom County, Washington) was locally significant (DI of 2.2 for powder) but small overall (Whatcom County accounted for just 0.15% of total powder seized).
Efforts to counter drug flows need to be grounded in data. The analysis here contradicts views—such as those used to justify certain tariffs—that treat the flows across the southern and northern borders as being comparably important.[1]
Introduction
Imagine someone who tried to pinch pennies by getting a friend to drive him to the airport whenever he took a luxury cruise. Or imagine a dieter who used artificial sweetener in his coffee whenever he ordered cheesecake for dessert. The U.S. effort to try to solve its fentanyl problem by focusing on the northern border with Canada is similar.
This report uses new data on large fentanyl seizures to illustrate that the great bulk of large loads continues to come from the south and that the exceptions are suggestive of specific situations that can be addressed directly.
Most illegal drugs are very potent, with doses measured in milligrams. Prohibition forces supply chains to operate in costly and inefficient ways, so drugs like fentanyl are extremely valuable per unit weight. When a 100-milligram fentanyl-laced pill sells for $10, that is the same price per gram as gold—even after gold’s recent price run-up.
When prices are that high, money is to be made arbitraging any gaps, which can lead to drugs flowing in unexpected directions. For example, the 2024 Dutch National Crime Assessment notes that after cannabis legalization, traffickers began smuggling cannabis into the Netherlands from the United States.[2] So if one asks whether anyone has ever moved fentanyl from Canada into the U.S., the answer is “of course,” just as people have smuggled drugs into Canada from the United States.[3]
The larger picture is that Canada and the U.S. are in the same boat: both are final-market countries beset by staggeringly high overdose death rates from synthetic opioids manufactured outside their collective borders.
Supply control can be one part of a suite of policy responses to this challenge; but to be effective, it must aim at the correct target.[4] The analysis here of the spatial distribution of large seizures suggests that the great bulk of fentanyl entering the U.S. continues to come from the south, not the north. That is no surprise. Many organized-crime groups specialize in moving things across the southwestern border, and it’s not only Mexican drugs: Colombian cocaine is transshipped through Mexico, human smugglers have been estimated to make billions of dollars annually helping people move north,[5] and guns cross the border in the other direction.
It is essentially impossible to seal a border against all drugs. Drugs are so compact that “body packers”[6] can swallow (in condoms) commercially meaningful quantities that are recovered, with the aid of laxatives, after the border has been crossed; and smuggling organizations sometimes intentionally sacrifice some couriers in order to distract law enforcement from other couriers.[7]
One large study published in 2014 found that drug mules were paid a median of only $1,300 per trip;[8] but traditionally, every pure kilogram of opioids that they delivered generated retail revenue of roughly $750,000.[9] That means that law enforcement can waste many taxpayer dollars indiscriminately locking up easily replaced couriers.[10] However, in many instances, intelligent supply restrictions have produced meaningful disruptions to opioid supply, including:
- The Turkish Opium Ban (1971) and breaking of the French Connection (1972–73) coincided with the end of the original heroin epidemic, with heroin prices in Washington, DC, quadrupling between February 1972 and March 1973.[11]
- Many significant law-enforcement successes occurred immediately preceding Australia’s 2001 “heroin drought,” which saw sharp declines in heroin purity, availability, and overdose deaths.[12]
- Florida’s aggressive (albeit belated) 2010–11 action against “pill mills” seems to have brought down opioid overdoses, with one study estimating that 1,000 lives were saved.[13]
- The long-term rise in U.S. opioid deaths was interrupted in 2018 with declines in the supply of carfentanil (a synthetic opioid even more potent than fentanyl).[14]
- The long-term rise in opioid deaths in British Columbia (hardest-hit of the Canadian provinces) was interrupted in 2019[15]—when China banned fentanyl[16] (although not its precursors, which allowed supply chains to quickly adapt to that action).
It is too soon to fully understand all the causes of the recent decline in opioid overdose deaths,[17] but it may be no coincidence that it followed a range of aggressive enforcement actions, particularly against the Sinaloa cartel.[18]
Although supply control is unlikely to fully solve the opioid crisis, it can make valuable contributions—far too valuable to squander by aiming at the wrong target.
The Data
The data analyzed here pertain to almost 200,000 heroin and fentanyl seizures made in the 50 U.S. states and Washington, DC, during 2013–24, but we focus on fentanyl data from the last two years. The data were collected by the High Intensity Drug Trafficking Areas’ (HIDTA) Performance Management Process (PMP) to assess operational efficiency.[19] To its credit, HIDTA makes anonymized subsets of those data available for research purposes, including our NSF-funded project studying the spread of “innovations” in illegal markets—with fentanyl displacing heroin from illegal opioid markets being one such innovation.[20]
Anonymization means that the data we received are geo-coded only to the county level, but that is actually an advantage over analyses focused only on seizures made at the border—e.g., those using U.S. Customs and Border Protection data.[21] When law enforcement seizes 10 kilograms in a small hamlet 30 miles inside the border, the odds are that those drugs were in transit, not destined for local consumption. We also have data for every county in the U.S., which helps gauge what the typical number of seizures is for a county, based on its own population. When law enforcement finds drugs in an urban area such as San Diego County, California, or Wayne County, Michigan, one should ask whether that is because of border proximity or whether the quantities merely mirror those of interior counties with similar populations (e.g., Miami-Dade or Sacramento).
Some seizures in the data are measured by weight in kilograms, and others are measured by number of dosage units (DU). For simplicity, the former are referred to as powder, although they could be resin or tar; and the latter are referred to as pills, although they could be tablets or capsules. A handful of seizures are liquid, which we exclude.
We focus on larger seizures. An individual could smuggle an amount suitable for his own use, but the primary concern is wholesale quantities. In particular, we focus on seizures of over 1 kilogram powder or more than 1,000 pills. Those cutoffs are conservative with respect to our conclusions; with larger cutoffs, the seizures skew even more toward the southwestern border.
We distinguish four types of border counties: 23 along the southern border with Mexico; 51 from Washington State to Maine that share a land border with Canada or are separated only by a river; 39 counties in the lower 48 that are separated from Canada by a lake (Superior, Huron, St. Clair, Erie, or Ontario); and 6 border counties (technically boroughs) in Alaska that had seizures. We treat Alaska as a special case because some of its land borders are nearly impenetrable mountains, and some areas with no land border are connected to Canada by ferry.
Numbers of Large Seizures by County Type
Table 1 reports the number of large seizures in 2023–24, as well as the quantity contained in those seizures, for the four types of border counties and for the rest of the 50 U.S. states plus Washington, DC. Patterns are similar in earlier years, but we focus on the more recent data.
Large seizures along the Canadian border with the lower 48 states are not disproportionate to the population of those border counties. For example, of 48 large seizures of fentanyl-containing powder, 41 were in Wayne County, Michigan, home to Detroit and one of the larger U.S. opioid markets. The fentanyl seized in Wayne County possibly came from Mexico, despite its proximity to Canada.
To account for this, the table lists the number of large seizures that one would expect in those counties if they hosted a proportionate number of the national total, based on their population.
The fourth set of rows lists the numbers in excess of what would be expected based on population, highlighting in orange the “problem areas” that have disproportionate numbers of seizures.
Table 1
Numbers of Large Fentanyl Seizures by Border Area, in Total and Relative to Expected Seizures
| Alaska | Canada, Land and Rivers | Canada, Lakes | Mexico, Land | Rest of U.S. | Total | |
| Population | 59,566* | 4,691,421 | 5,612,870 | 7,783,862 | 313,368,017 | 331,515,736 |
| % of Total | 0.02% | 1.42% | 1.69% | 2.35% | 94.53% | |
| Number of large seizures (2023–24) | ||||||
| Powder | 1 | 48 | 33 | 572 | 1,803 | 2,457 |
| Pills | 26 | 71 | 36 | 757 | 5,154 | 6,044 |
| Number expected based on population | ||||||
| Powder | 0.4 | 35 | 42 | 58 | 2,322 | |
| Pills | 1.1 | 86 | 102 | 142 | 5,713 | |
| Number in excess of what would be expected | ||||||
| Powder | 0.6 | 13 | – 9 | 514 | – 519 | |
| Pills | 24.9 | – 15 | – 66 | 615 | – 559 | |
| Quantity seized in large seizures (2023–24) | ||||||
| Powder (kgs) | 1 | 172 | 203 | 5,556 | 7,936 | 13,867 |
| Pills (000s) | 121 | 1,102 | 295 | 86,332 | 135,988 | 223,838 |
| Quantity expected based on population | ||||||
| Powder (kgs) | 2.5 | 196 | 235 | 326 | 13,108 | |
| Pills (000s) | 40.2 | 3,168 | 3,790 | 5,256 | 211,584 | |
| Quantity in excess of what would be expected | ||||||
| Powder (kgs) | – 1.3 | – 24 | – 32 | 5,230 | – 5,172 | |
| Pills (000s) | 80.7 | -2,066 | – 3,495 | 81,077 | – 5,597 | |
*Alaska population is the total population in the six counties that had seizures.
Source: Author analysis of High Intensity Drug Trafficking Areas’ (HIDTA) Performance Management Process (PMP)
Counties along the Mexican border have a greatly disproportionate share of the large seizures. They account for only 2.35% of the U.S. population but host 12.5% of large pill seizures, 23% of large powder seizures, and about 40% of the quantity yielded by those seizures for both powder and pills.
By contrast, the counties in the lower 48 states that border Canada (land or water) account for 3.1% of the U.S. population, but less than 2.5% of the large seizures and just 0.6% of the pills and 2.7% of the powder by weight. Among those counties, the only highlighted data cell concerns the number of large powder seizures (which, as mentioned, are almost all in Detroit). That excess of 13 “extra” powder seizures is smaller than the “deficit” of 15 in large pill seizures, and the weight of those powder seizures is below what would have been predicted, based on population.
The counties across lakes from Canada are particularly underrepresented, suggesting that waterborne smuggling there is not an issue.
Comparing the land borders, 32 times as much powder and 78 times as many pills were seized in counties along the Mexican border as were seized in the lower 48 counties sharing a land border with Canada.
The qualification “lower 48” matters. There were 26 seizures totaling 121,000 pills in Alaska counties that border Canada—triple what would be expected based on those counties’ population but still small relative to the total Alaska market. Those 121,000 pills are 0.05% of the U.S. total, whereas Alaska comprises 0.22% of the U.S. population. It may be that the Alaska illegal opioid market, which is physically distant from Mexico, obtains a portion of its supply from Canada.
In sum, there is no evidence in these recent data to refute the conventional wisdom that the vast majority of fentanyl crossing U.S. borders comes from the south, not the north.
Mapping the Largest Seizures
We next look beyond the borders and ask where the largest seizures throughout the entire lower 48 states were. (Alaska and Hawaii do not have very large seizures.)
Figure 1 shows the locations of the 50 largest powder seizures (red circles) and the 50 largest pill seizures (blue circles) in the 2023–24 data. (There are fewer than 100 circles because one county can have more than one of the largest seizures.) The sizes of the circles indicate the size of the largest seizure in that county.

Almost all the largest pill seizures occur along or near the southwestern border—specifically, along the California and Arizona borders, not the New Mexico or Texas borders. The largest powder seizures also occur there or in large cities. Among the 100 largest fentanyl seizures (50 pills and 50 powder), the only ones that occurred near the Canadian border were those in Seattle and Detroit.
The story is similar if we focus on the 50 counties containing the greatest total quantity of pills seized and the 50 containing the greatest total quantity of powder seized. These locations are illustrated in Figure 2. A county could appear in this figure if it had a large number of medium-large seizures, even if none individually made the top-50 list shown in Figure 1.

For powder, the Mexican-border counties in California and Arizona again stand out, and most of the other large powder-seizure counties comprise large cities. That includes Detroit, as well as many other large U.S. cities.
The pattern for counties with the largest numbers of pills seized is a bit different. Many of these counties lie along or near the Mexican border; others comprise large cities in the Southwest (Maricopa County/Phoenix and Clark County/Las Vegas), or are near large cities (e.g., Orange, Riverside, and San Bernadino Counties, around Los Angeles).
However, there were several counties in the middle of the country with medium-size, but not truly large, cities, including Albuquerque, Omaha, and St. Paul. Even more striking, nine of those top 50 pill-seizure counties had a population below 300,000 and were not adjacent to a major metro area (Table 2).
Table 2
Nine Less-Populous Interior Counties Where Large Quantities of Pills Were Seized, 2023–24
| County, State | # of Dosage Units Seized | Rank Among Top 50 Counties | # of Large Seizures | County Population | Major City or Metro Area | City Population |
| Mesa, CO | 2,581,399 | 14 | 32 | 155,705 | Grand Junction | 63,447 |
| Jackson, OR | 1,719,529 | 23 | 15 | 223,263 | Medford | 83,412 |
| Navajo, AZ | 1,686,889 | 24 | 29 | 106,715 | Show Low | 11,732 |
| Cibola, NM | 1,292,917 | 27 | 13 | 27,052 | Grants | 9,163 |
| Barton, KS | 1,210,186 | 28 | 11 | 25,499 | Great Bend | 14,733 |
| Merced, CA | 1,033,649 | 34 | 9 | 282,447 | Merced | 86,333 |
| Burleigh, ND | 1,002,951 | 37 | 24 | 98,455 | Bismarck | 73,622 |
| Gila, AZ | 999,506 | 38 | 5 | 53,272 | Globe | 7,249 |
| Washington, UT | 795,779 | 44 | 24 | 180,289 | St. George | 95,342 |
Source: Author analysis
Most of these counties contain interstate routes or, in the case of Gila, Arizona, a major U.S. route (Route 60). Barton, Kansas, is the exception. Perhaps these counties are way stations on a smuggling route, but one does not see the same pattern with powder seizures.
Digging Deeper: County-Level Disproportionality in Seizures
In aggregate, the Mexican, not the Canadian, border is the major source for fentanyl entering the U.S., but we can exploit the county-level character of the data to look for counties with disproportionate seizures, even if they do not loom large for the nation as a whole. We report the results for recent years (2023–24), but patterns are similar for the entire period of 2013–24.
We calculated a Disproportionality Index (DI), which measures the actual quantity seized relative to what would be expected based on the county’s population. We computed DIs separately for powder and pills, and then averaged the two. A DI of 1.0 means that seizures are proportionate to local population; below 1.0 indicates less than expected; and over 1.0 indicates a greater quantity seized than expected.
Because of random fluctuations, a county can be a bit above or below 1.0, but there were 67 counties with average DIs greater than 2.5, led by Santa Cruz, Arizona, with an average DI of 417. Only one county on the Canadian border made the list: Okanogan County, Washington, coming in at no. 56, with a DI of 3.3.
Okanogan County recorded zero seizures until December 2022, but makes the list because of a single large enforcement operation in April 2023 against a Mexican-led organized-crime group that was supplying methamphetamine and fentanyl to eastern Washington, including the Colville Indian Reservation.[22] The route that those drugs took is not known (at least to us), so we cannot rule out the possibility that this Mexican-led operation preferred to source fentanyl via Canada, but it could also be Mexican fentanyl being delivered to customers who just happen to live near the Canadian border.
Figure 3 is a heatmap color-coding all counties in the lower 48 states based on their average DI score in 2023–24. White indicates an average DI below 2.5. For the other 67 counties, the darker the shade, the higher the average DI score.
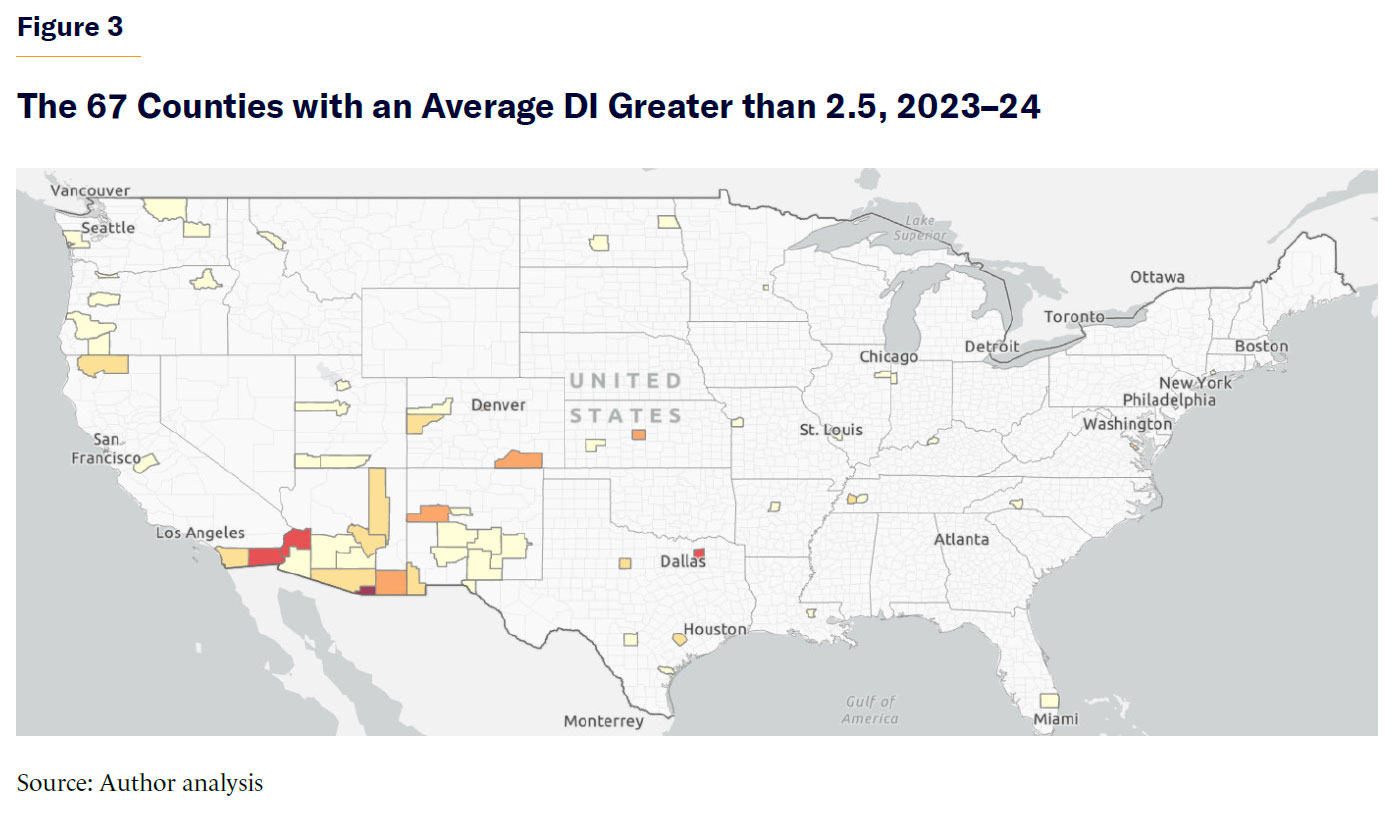
Table 3 shows all 18 border counties with an average DI greater than 1.0 in 2023–24. Hudspeth County, Texas, has the highest DI for powder, while Santa Cruz County, Arizona, is the highest for pills, as well as overall, with quantities of large seizures that vastly outstrip what one would expect, based on its small population. Much of the top of the table is dominated by counties along the southwestern border. Counties along the Canadian border are listed in boldface.
Table 3
Border Counties with Quantities of Fentanyl Seized Disproportionate to Population, 2023–24
| County and State | Population | Powder Seized (Kg) | Pills Seized | DI Powder | DI Pills | Average DI |
| Santa Cruz, Arizona | 47,663 | 86.5 | 25,448,048 | 43.4 | 790.8 | 417.1 |
| Hudspeth, Texas | 3,202 | 23.7 | 133,032 | 176.6 | 61.5 | 119.1 |
| Imperial, California | 179,710 | 749.8 | 13,484,176 | 100 | 111 | 105 |
| Cochise, Arizona | 125,440 | 6.7 | 6,048,580 | 1.3 | 71.4 | 36.3 |
| San Diego, California | 3,298,647 | 4388 | 21,740,068 | 31.8 | 9.8 | 20.8 |
| Hidalgo, New Mexico | 4,177 | 0 | 92,715 | 0 | 32.9 | 16.4 |
| Pima, Arizona | 1,043,441 | 51.3 | 14,862,877 | 1.2 | 21.1 | 11.1 |
| Maverick, Texas | 57,881 | 19.5 | 228,261 | 8 | 5.8 | 6.9 |
| Yuma, Arizona | 205,009 | 4.2 | 1,032,782 | 0.5 | 7.5 | 4 |
| Okanogan, Washington | 42,097 | 0 | 185,529 | 0 | 6.6 | 3.3 |
| El Paso, Texas | 865,710 | 119 | 1,142,014 | 3.3 | 2 | 2.6 |
| Juneau, Alaska | 32,250 | 1.2 | 87,768 | 0.9 | 4 | 2.4 |
| Hidalgo, Texas | 870,790 | 61.8 | 1,529,064 | 1.7 | 2.6 | 2.1 |
| Whatcom, Washington | 226,844 | 20.8 | 223,875 | 2.2 | 1.5 | 1.8 |
| Dona Ana, New Mexico | 219,566 | 6.2 | 409,615 | 0.7 | 2.8 | 1.7 |
| Ketchikan Gateway, Alaska | 13,950 | 0 | 30,041 | 0 | 3.2 | 1.6 |
| Webb, Texas | 267,114 | 30.2 | 63,943 | 2.7 | 0.4 | 1.5 |
| Wayne, Michigan | 1,793,896 | 143.8 | 554,157 | 1.9 | 0.5 | 1.2 |
Source: Author analysis
Apart from Okanogan County, two Alaska counties appear near the bottom of the table, with a DI score for pills between 3 and 4. It seems plausible that they are portals to the Alaska market, although the quantities seized are too small for them to be of significance in the much larger market in the lower 48 states.
Whatcom County, Washington, has a DI of 2.2 for powder seized in 2023–24. That includes two large seizures totaling about 20 kilograms in 2024, substantially exceeding what its population of 226,844 would seem to warrant, but it is still only 0.15% of total powder seized nationwide.
Whatcom County data also include what appear to be nine or 10 large pill seizures in 2023. (The exact count is unclear because of ambiguity about how many pairs of seizures on the same day might be duplicate observations.)
Whatcom is on Washington’s coast, just south of Vancouver, British Columbia, and is transected by Interstate 5, which connects Vancouver to points south. If one were to smuggle opioids from China or Mexico into the U.S. via Canada, that would be a logical route.
The table also includes Wayne County, Michigan. Of all the counties along the Canadian border, it had the greatest quantities of fentanyl powder and pills seized. Yet its average DI is only slightly above 1.0. Detroit is such a large city that its population alone can plausibly generate substantial seizures, independent of the fact that it happens to lie along the Canadian border.
Overall Time Trends
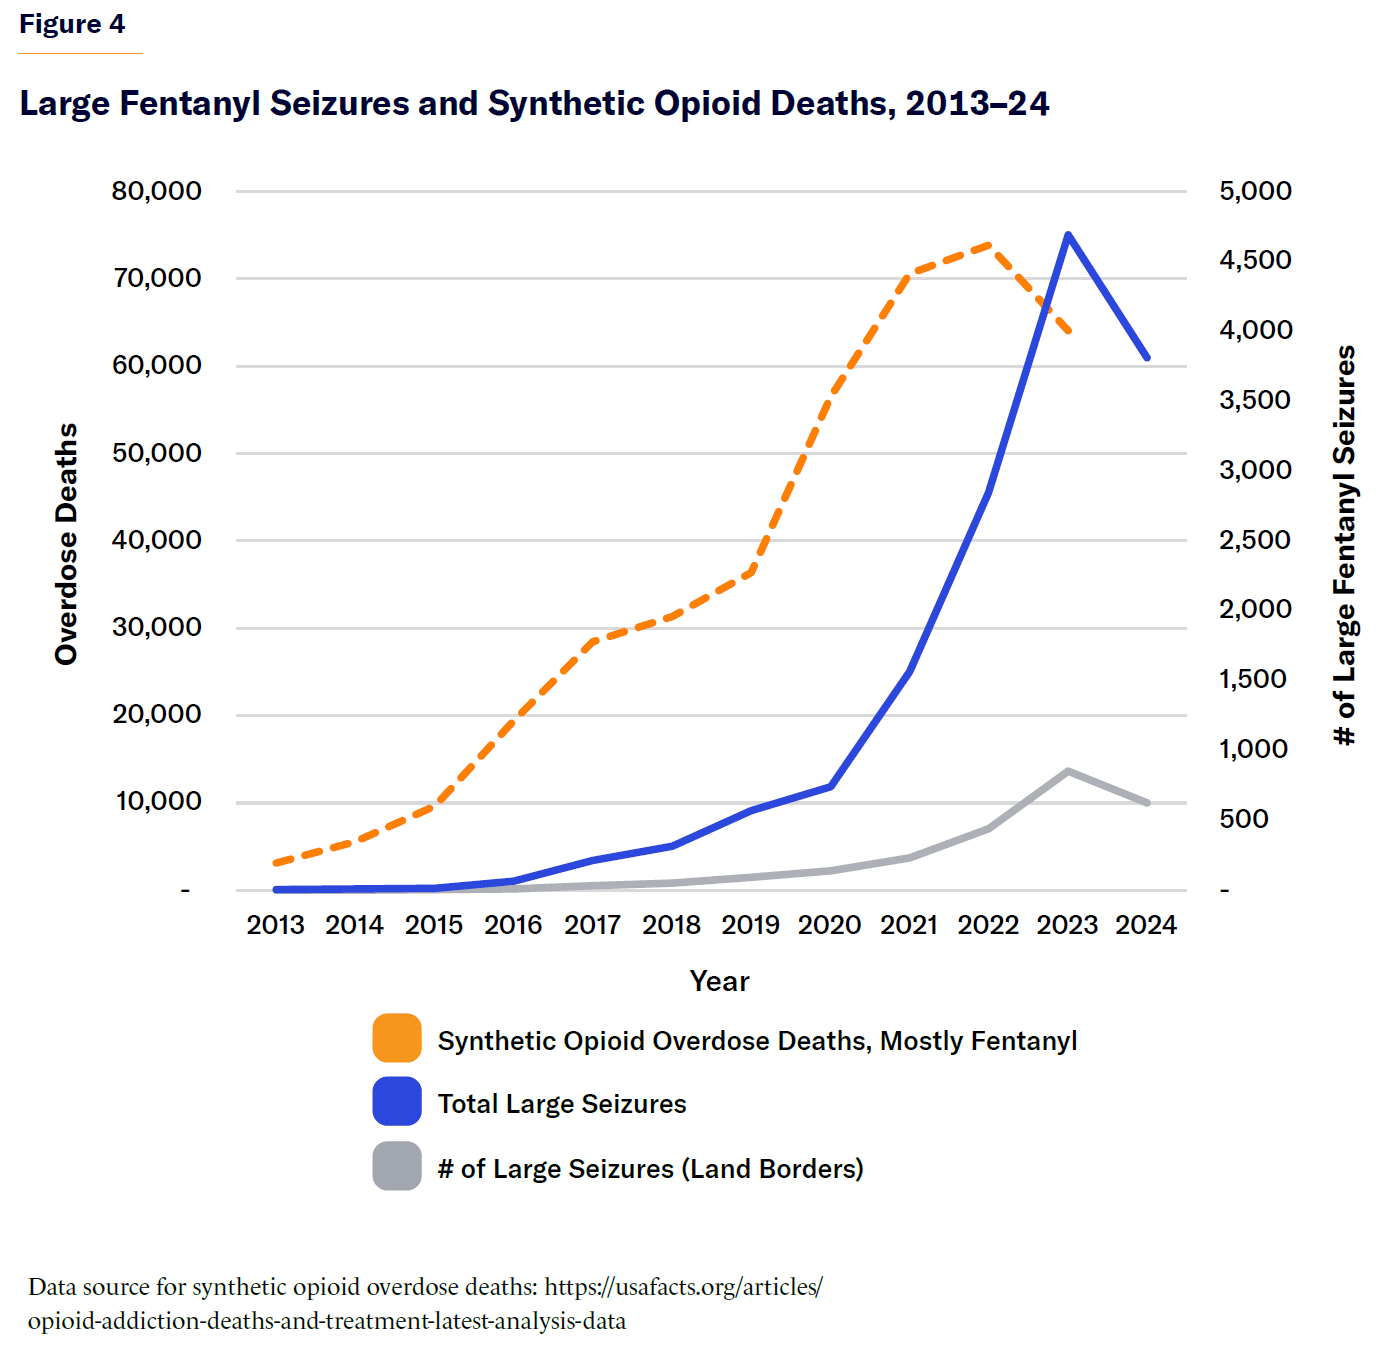
We plot trends in the number of large fentanyl seizures, combining powder and pills, both nationwide and along land borders (Figure 4). We overlay on the same graph (using the right-hand vertical axis) the total number of synthetic opioid overdose deaths (mostly fentanyl). Unsurprisingly, the trends are broadly parallel, although the overdose rate rose first—perhaps because enforcement policy responded to the problem, but with a slight lag.
No causal inferences can be drawn from a simple descriptive plot, but the pattern is consistent with expanding fentanyl supply through 2023, leading to more large seizures and more deaths; and a contraction in supply in 2024, leading to reductions in large seizures and deaths.
Conclusion
Citizens and policymakers alike agree that illegally manufactured fentanyl (IMF) is a scourge, killing very large numbers of people in the United States and Canada. They also agree that the precursors from which IMF is synthesized mostly come from China.
There is a healthy debate about how much efforts to control the supply of IMF and the precursors can do to reduce deaths. Some support deploying a range of supply-control measures, including diplomacy, law enforcement, and even military assets.[23] Others are skeptical, at least of using the military, and suggest focusing on treatment, prevention, or harm-reduction approaches.[24]
We hold a middle-of-the-road view, not expecting supply restrictions to solve the problem but believing it reasonable to hope that such restrictions can make a dent, as one valued part of a comprehensive approach. If supply control reduced deaths by 20% and for just one year, more than 10,000 lives would still be saved.
That leaves the question of what the priority targets for policymakers should be. This analysis of the newly available data makes clear that when law enforcement finds large quantities of fentanyl pills or powder, it usually occurs along or near the southwestern border with Mexico, or in populous counties that could support large local markets. For pills, but not powder, large seizures also occur in some smaller counties in the interior.
Counties along the Canadian border are not an important part of this story. The only counties along the Canadian border with large seizures are:
- Wayne County, Michigan, where the quantities are no more than what would be expected, given the presence of Detroit and its large population base.
- Certain counties in Alaska that could be portals from Canada to the broader Alaska market, although those quantities are much too small to be of consequence beyond Alaska.
- Okanogan County, Washington, where large quantities were seized in April 2023 from Mexican-led organized-crime groups that were supplying rural and Native American populations near the Canadian border.
- Whatcom County, Washington, which may be a portal for IMF from Canada, although the quantities seized in 2023–24 represent just 0.10% of the pills and 0.15% of the powder seized nationwide.
Whatever the merits or drawbacks of tariffs on imports from Canada—a question of economics and international relations that goes far beyond our analysis—such actions cannot be justified as part of a pragmatic and data-informed response to the threat of fentanyl to the United States.
Greater cooperation between U.S. and Canadian law enforcement could help plug the small flows into Alaska and Whatcom County and, more important, could pool intelligence concerning the roles of Chinese and Mexican organized-crime groups that drive the supply chain feeding both countries’ markets.
Energies related to U.S.–Canadian border control, however, might more profitably be directed toward the southwestern border or the many packages and containers that enter the country other than across land borders.
Acknowledgments
This work was supported in part by a grant from the National Science Foundation on Improving Our Understanding of Illegal Opioid Supply Networks (2146230). All views and opinions expressed here are those of the authors and do not necessarily reflect the views or opinions of any organization with which the authors are affiliated.
About the Authors
Jonathan P. Caulkins is the Stever University Professor of Operations Research and Public Policy at Carnegie Mellon University’s Heinz College and a member of the National Academy of Engineering. He specializes in systems analysis of the supply chains supporting illegal markets. Issues surrounding opioid markets and regulation, Covid-19, and cannabis legalization have been his focus in recent years.
Bishu Giri is an alumnus of Heinz College at Carnegie Mellon University and a data scientist specializing in natural language processing, machine learning, and geospatial analysis. He is interested in applying data science methods to analyze public policy issues, with particular interest in areas such as drug policy.
Endnotes
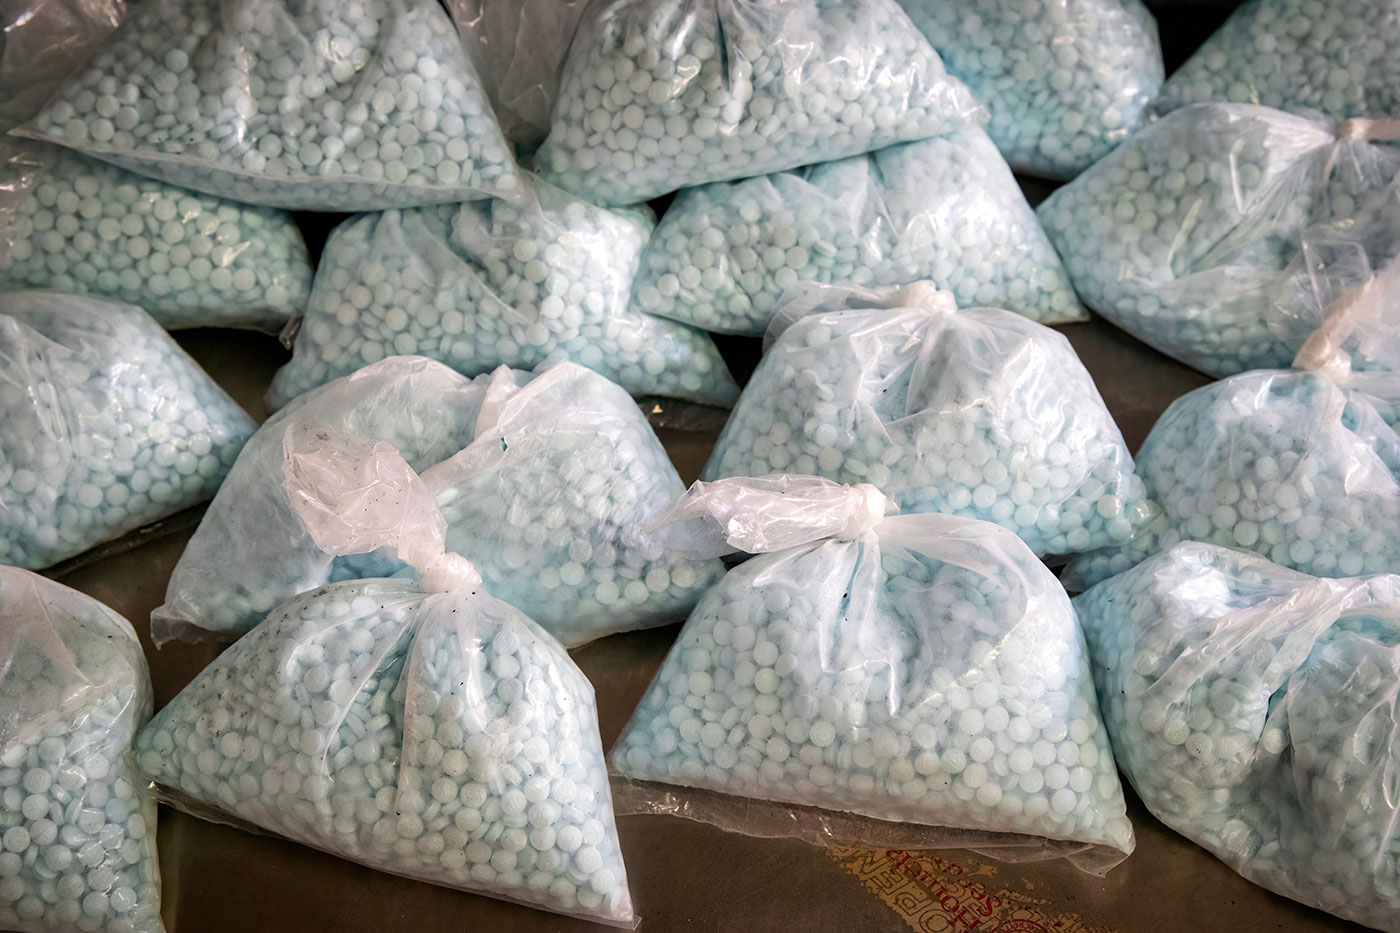
Photo: Tennessee Witney / iStock / Getty Images Plus
Are you interested in supporting the Manhattan Institute’s public-interest research and journalism? As a 501(c)(3) nonprofit, donations in support of MI and its scholars’ work are fully tax-deductible as provided by law (EIN #13-2912529).
Source link


