Whether he was lucky, or good, it may not matter – especially for those who made money on his short-term trade recommendation – but one week ago, Bank of America CIO Michael Hartnett wrote that in the last week of March, the sell signal ended (after the S&P tumbled almost 10% peak-to-trough since it was triggered in December); and noted that “with oil >$100/bbl, 30Y yields at 5%, and the S&P , which traditionally represents a key market inflection point.
To be sure, we haven’t yet observed the Fed unleash any panicked policy moves (although last week’s Treasury-to-Oil correlation snapping certainly hinted that something is coming), but markets tend to price major moves before they happen and they certainly did that last week when the S&P surged 3.5%, ending a streak of 5 consecutive weeks lower and the best weekly return since November 25.

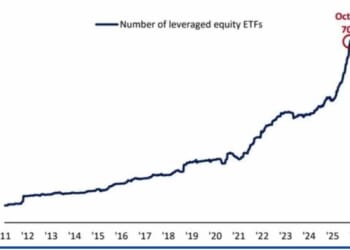
Yet although his own signal no longer say to sell stocks, it has yet to give the all clear on buying them as Hartnett explained in last week’s Flow Show. And so fast forwarding to Friday’s weekly Flow Show update from Michael Hartnett (available to pro subs), the BofA chief investment strategist instead urges clients to focus on bonds, and says that “Nothing quite says “own duration” like biotech (XBI) closing at the highs.” Remarkably with most other sectors – except energy – in freefall, biotech has somehow managed to not only hang in there, but trade near at a 5 year high.

But if bonds aren’t your thing, and the BofA investment strategist has long said that 5% on the 30Y is the Trump put low for the bond market, Hartnett has four other investing ideas, all of which have the same core assumption – a short Iran war (a rather precariously base case).
Should that pan out, Hartnett believes the logical follow through is that there will be “no recession as Trump approval ratings infer some Vitamin C trades to pep portfolio” among which:
- Curve steepeners to play lower/rate cuts,
- Commodities to play geopolitical grab for resources,
- China to play May Trump-Xi & consumption reorientation

- Consumer stocks to play big post-war policy shift to address cost of living.
Some other factors giving Hartnett optimism that the worst is now behind, is his view that the origin of Q1 VaR shock liquidation (which we discussed extensively in “VaR Shocked: How Much Higher Can Yields Rise Before Crashing Stocks“) was yield curve flattening, and it ended last Friday as 2-year UST yield failed to break >4%. Meanwhile, the peak liquidity losers (bitcoin, private credit, software) are groping for a price floor, and if XBT, PSP, IGV plus banks (BKX) can catch bid on peak yields/steeper curve, expect a soft landing… but if they can’t…hard landing coming.
Turning to the economy, Hartnett finds more encouraging signs, starting with the deteriorating US labor market where the plunging “quits rate” (see”Job Openings Drop As Hires, Quits Unexpectedly Plunge To Six Year Low“) continues to predict Fed cuts not hikes.

Yet payrolls remain positively correlated with profits…

… and given elevated S&P 500 EPS estimates (up from $310 to $323 YTD), a few months of strong job gains will be needed to prevent earnings estimates following stock prices lower.

Next a quick look at the latest weekly fund flows, where there were no major surprises as every asset class except crypto saw inflows ($11.6bn to stocks, $3.3bn to bonds, $0.9bn to gold (1st inflow in 5 weeks), $0.4bn from crypto) leading to the following key flows to know (more in the full Flow Show note available to pro subs):
- IG + HY bonds: $7.9bn combined outflow, biggest since Apr’25 (Chart 8);
- Bank loans: $0.2bn inflow, 1st in 6 weeks;
- Europe equities: $3.5bn outflow, biggest 2-week outflow ($6.6bn) since Dec’24 (Chart 9);
- Japan equities: $0.8bn outflow, biggest since Nov’25;
- Tech: $2.1bn inflow, biggest in 4 weeks;
- Consumer: $1.1bn outflow, biggest since Dec’25.

Couple more flow observations, starting with the Bank of America Bull & Bear indicator which dropped further, to 6.3 from 7.4 (lowest since Jun’25, biggest weekly drop since Apr’25) on deteriorating global stock index breadth, HY bond outflows, wider spreads in HY bonds & subordinated bank debt.

This underscores the key theme of last week’s Flow Show namely that the BofA Bull & Bear Indicator contrarian “sell signal” for stocks ended March 25th (triggered Dec 17th)… but a buy signal is still missing. That’s because only 16% of MSCI global (ACWI) equity indices are trading below both 50-day & 200-day moving averages, not close to the -88% “buy signal” for stocks; the most recent “oversold” reading was -39% on Mar 23rd, and the most recent “overbought” reading was 89% on Jan 28th. Confirming our previous reporting on this market technicals, the BofA positioning data does not show bull capitulation, and instead argues that any rally from recent S&P 500 lows will struggle to advance above 6800 (50-day & 100-day MA); that said, “sell the rip” is now very in vogue as trading consensus right now.
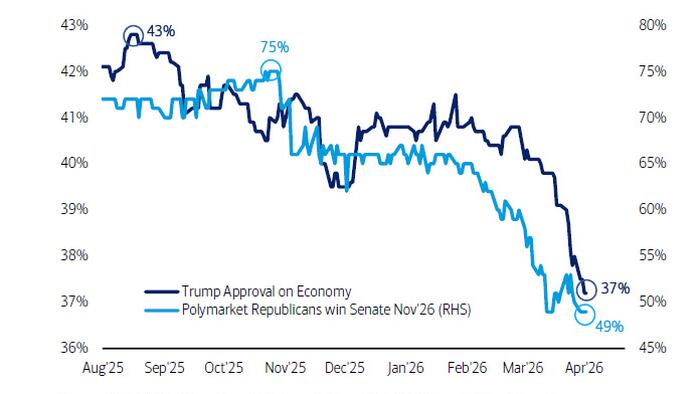
Going back to the week’s key geopolitical theme, the War in Iran, Hartnett repeats what he said a few weeks ago, that politics continue to argue for short not long war, because the new lows in Trump approval 41%, on economy 37%, on inflation 33%, are all correlated with Nov midterm probability of GOP maintaining control of House (down to 15%) and the Senate (down to 49%).

That said, the Senate map is tough for Democrats who need to flip four of six races in Maine, North Carolina, Ohio, Iowa, Alaska, Texas, plus defend New Hampshire, Michigan, Georgia seats. And if geopolitics wasn’t enough, Hartnett warns that the big Q2 political/policy risk for markets is that trade policy once again becomes US tool to pressure friends & foes into support for US geopolitical aims. Sure enough, Trump’s announcement of rising pharma tariffs, expansion of tariffs on steel, aluminum, copper this week, was just the start.
And one final warning from Hartnett, who rem inds readers of the popular and contentious “skyscraper curse” which says that “completion of world’s tallest buildings has coincided with hubristic economic & market tops as bubbles popped and ended misallocation of capital” – some examples include the Chrysler Building in 1930 (Oct’29 crash & Great Depression), Sears Tower in 1974 (stagflation era took Dow Jones 10 years to surpass 1973 high), Petronas Towers in 1996 (Asia financial crisis), Burj Khalifa in 2009 (secular peak in oil prices plus Global Financial Crisis), Shanghai Tower in 2014 (followed by China stock market bubble/pop & property market slump );

Fast forward to today when the 2020s hubris will be biggest AI datacenter not tallest building; and ground zero will be Utah’s Delta Gigasite which aims to be world’s largest, delivering 10+ gigawatts of capacity, construction started late ’25, its first power availability is expected to start in 2027… it’s why Hartnett is still short AI hyperscaler corporate bonds, and why Microsoft, Meta, Oracle are now cutting jobs aggressively to help fund datacenter capex.
More in the full Hartnett Flow Show note available to pro subs.