

Introduction
For over 50 years, the National Assessment of Educational Progress (NAEP), the Nation’s Report Card, has measured student achievement in reading and math across the United States.[1] The recently released 2024 results confirm a long-term crisis in education, with student performance stagnating or declining despite decades of federal spending and education reform initiatives. Federal interventions such as No Child Left Behind (2002),[2] Common Core (2010),[3] and Every Student Succeeds Act (2015)[4] were designed to improve student academic outcomes. While No Child Left Behind (NCLB) drove improvements in student achievement initially, NAEP scores indicate that progress stalled under Common Core and declined further after Every Student Succeeds Act (ESSA) weakened accountability measures. More funding has not made a difference. Even as national per-pupil spending has exceeded $17,000 on average per student, reading proficiency has remained unchanged, and math scores are at their lowest in two decades.[5] This paper examines the factors contributing to these declines and proposes evidence-based solutions to improve student achievement.
Key findings include:
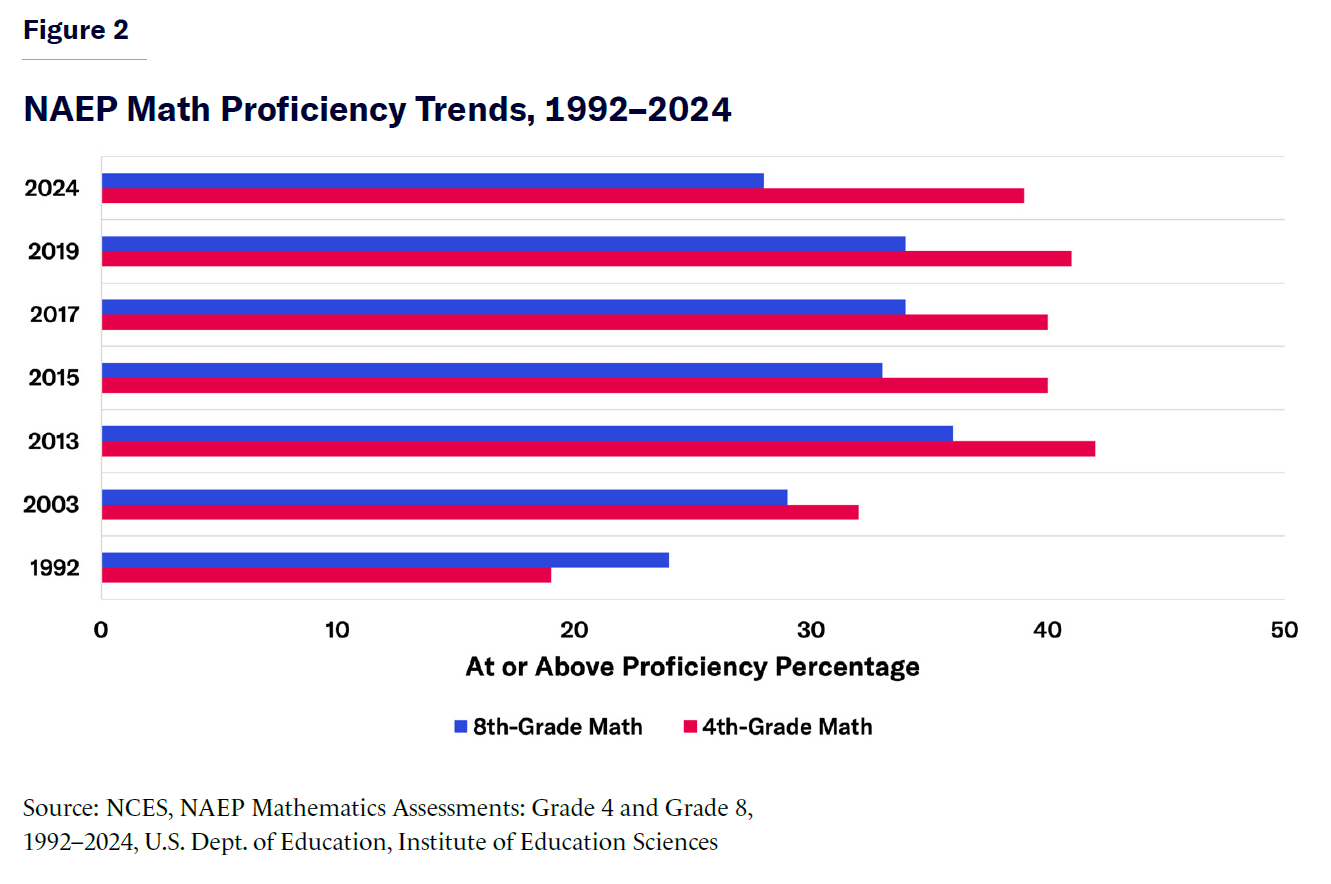
- Student proficiency levels have stagnated or declined since the early 1990s, with fourth- and eighth-grade reading proficiency at an average of 30%–31%. Math proficiency for both grades peaked in 2013 (42% for fourth grade and 35% for eighth grade) but has declined to 39% (fourth grade) and 28% (eighth grade).
- Public school performance improved under NCLB (2003–13) but stagnated after Common Core implementation and declined under ESSA.
- Urban districts such as New York City, Chicago, and Los Angeles have consistently shown low proficiency rates (for example, NYC’s fourth-grade proficiency stands at 28% for reading and 33% for math).
- Between 2013 and 2024, the lowest-performing public school students (25th percentile) lost an average of 12 points, compared with an 8-point decline among charter school students. Among average-performing students (50th percentile), public schools declined by 5 points, while charter schools remained stable. Charter schools provided more stability across all student performance levels.
- States with collective bargaining laws for educators saw steeper declines in reading (–3.7% in fourth grade, –4.9% in eighth grade) and math (–2.7% in fourth grade, –4.4% in eighth grade) compared with smaller declines in non-collective bargaining states. While non-collective bargaining states started with lower scores, their rate of decline was smaller, suggesting greater flexibility in adapting instructional practices.
- Even with record-high education spending per student in some states, such as New York, student achievement remains low, demonstrating that funding alone does not drive academic success.
This paper concludes with four recommendations, informed by these findings and trends, to bring accountability back to American classrooms and sustain reading and math proficiency among American students.
National Trends
The 2024 NAEP results released in January confirm a long-term stagnation in literacy, with reading proficiency remaining nearly unchanged since the early 1990s (Figure 1). Reading proficiency improved slightly from 1992 to 2013, peaking in 2013 at 35% (fourth grade) and 36% (eighth grade). However, by 2024, scores had regressed to early 2000s levels, with just 31% of fourth-graders and 30% of eighth-graders proficient in reading.

Math proficiency followed a similar pattern (Figure 2). In 1992, only 19% of fourth-graders and 24% of eighth-graders were proficient. Scores improved steadily through the early 2000s, reaching 32% (fourth grade) and 29% (eighth grade) by 2003. As with literacy, the peak occurred in 2013, with 42% of fourth-graders and 36% of eighth-graders proficient. However, after 2015, scores declined again—fourth-grade math plateaued at 40%, while eighth-grade scores fell to 33%. In 2024, only 39% of fourth-graders and 28% of eighth-graders met proficiency standards.
While national figures confirm a widespread decline in academic performance, state-level data reveal critical differences in the severity and trajectory of these declines.
State Trends
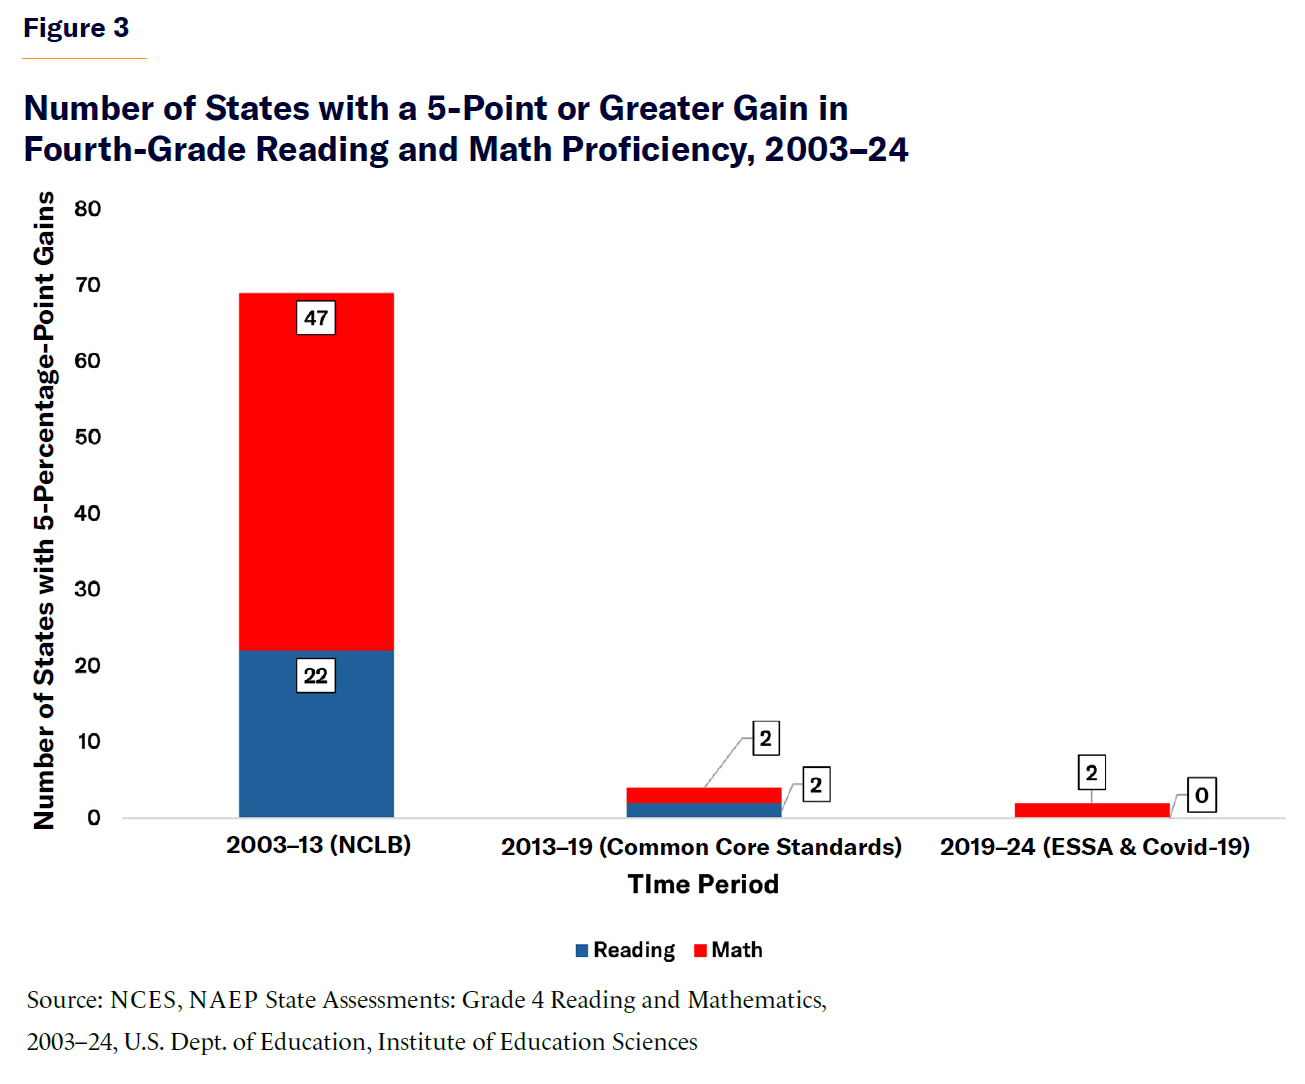
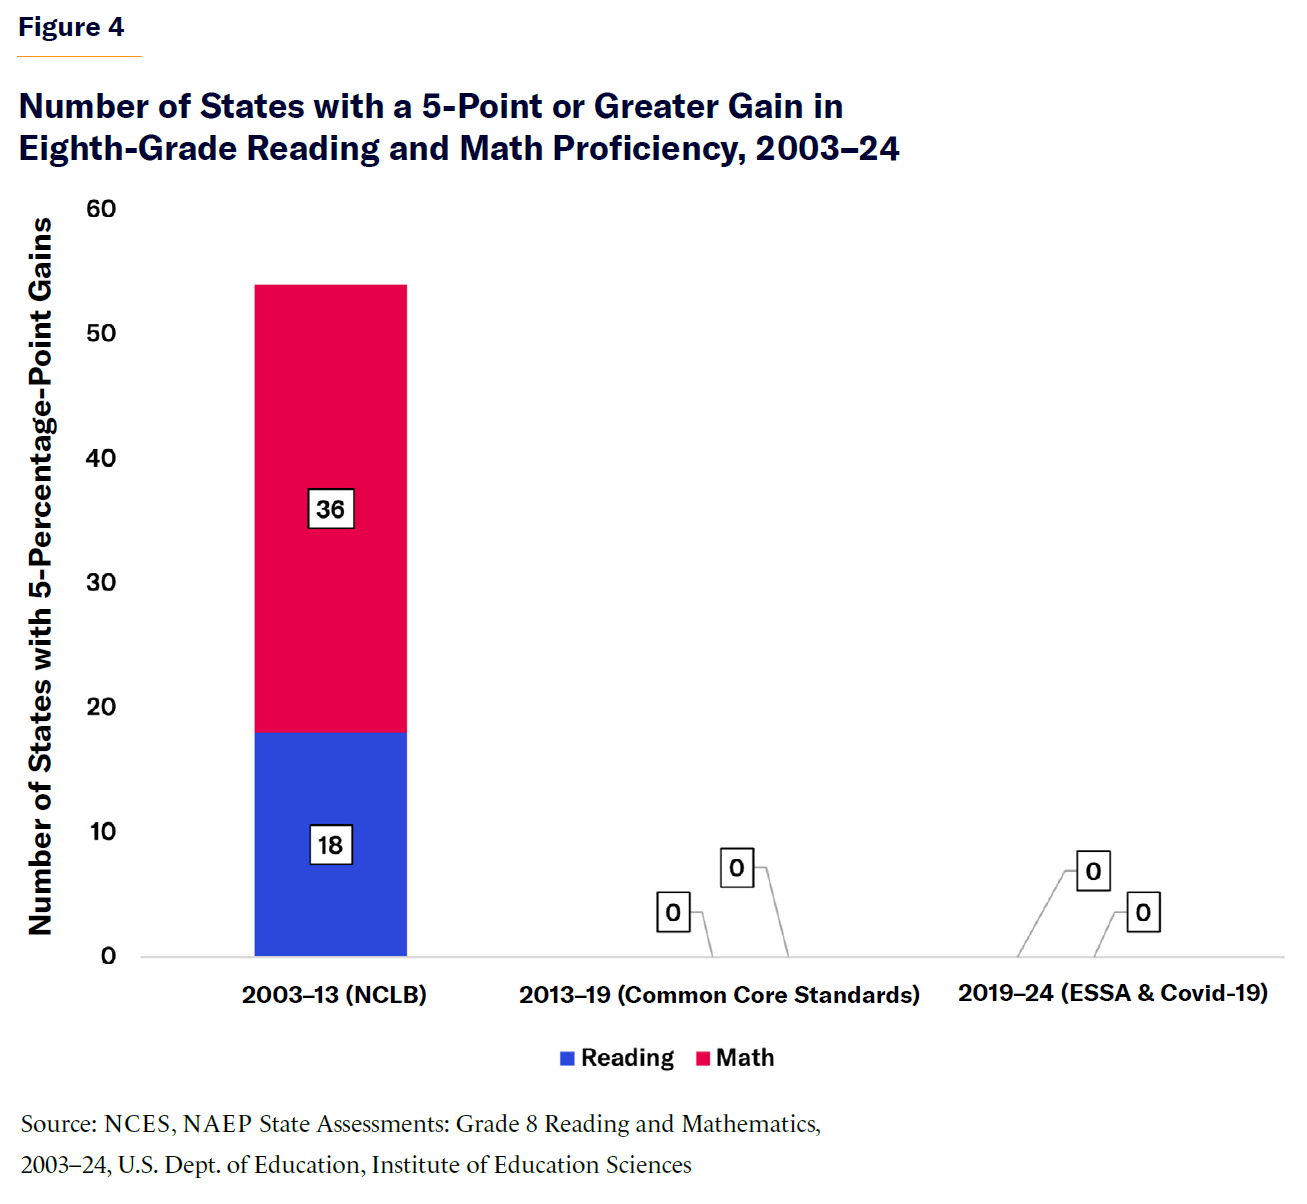
State-level data reveal where these declines are most severe and which states have resisted these downward trends. Apart from Massachusetts, no state had more than half its students reach proficiency in reading or math, highlighting the urgent need for systemic change in education. Between 2003 and 2013, student performance improved in many states, with 22 states seeing at least a 5-point gain in fourth-grade reading and 47 states seeing the same increase in fourth-grade math (Figure 3). Gains were also evident (Figure 4) in eighth-grade reading (18 states) and math (36 states). This period overlaps with the implementation of NCLB, which emphasized accountability, standardized assessments, and interventions for struggling schools.
Between 2013 and 2019, progress stagnated and even began to decline. Only two states (California and Mississippi) showed a 5-percentage-point increase in fourth-grade reading, and just two states (Florida and Mississippi) improved at this level in fourth-grade math. Among eighth-grade students, not a single state achieved a 5-percentage-point gain in reading or math. This period coincided with the Department of Education adopting Common Core Standards, which focused on a standardized curriculum and reduced direct accountability for schools and teachers.
From 2019 to 2024, no state recorded a 5-percentage-point or more increase in reading proficiency; just two states (Alabama and Louisiana) saw these gains in fourth-grade math. For eighth-graders, not a single state achieved a 5-percentage-point gain in either subject. Shortly before this period, the Adequate Yearly Progress measurement, which focused on states moving toward student growth models rather than student proficiency benchmarks, was eliminated under ESSA.[6] Adequate Yearly Progress was the term for the amount of annual achievement growth expected to be accomplished by students in a particular school, district, or state under NCLB.[7] It was a useful diagnostic tool that determined how schools needed to improve and how schools should delegate limited resources to achieve those goals.
Also during this period, significant Covid-19 pandemic disruptions accelerated the existing academic gaps.
These trends indicate that while accountability-driven policies like NCLB showed early academic progress, the shift in more recent educational policies (Common Core Standards and ESSA) led to long-term declines. Removing measurable student outcome requirements resulted in ineffective educational models. While some states have struggled more than others, the crisis is even more pronounced in the largest cities in the U.S., where low proficiency rates have remained persistent, as we will see next.
Urban Trends
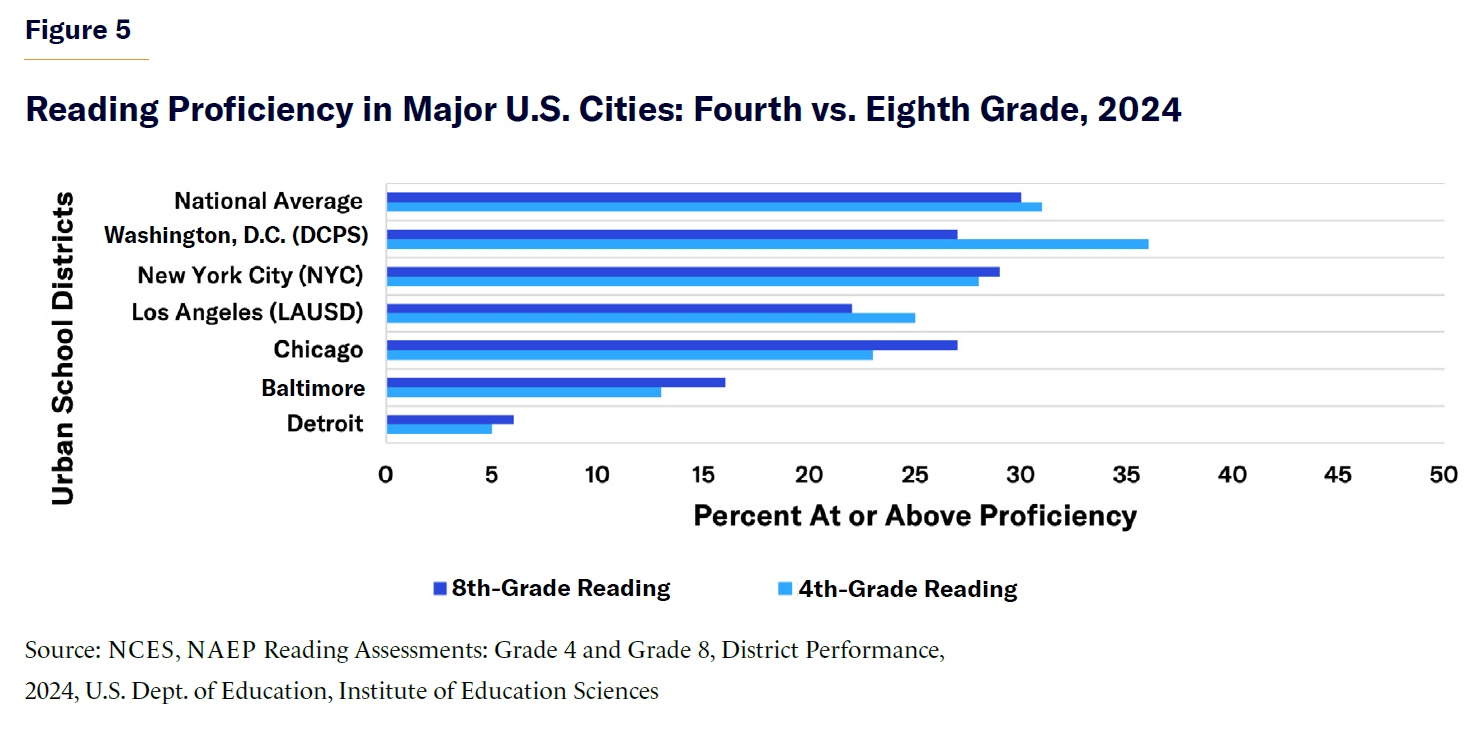
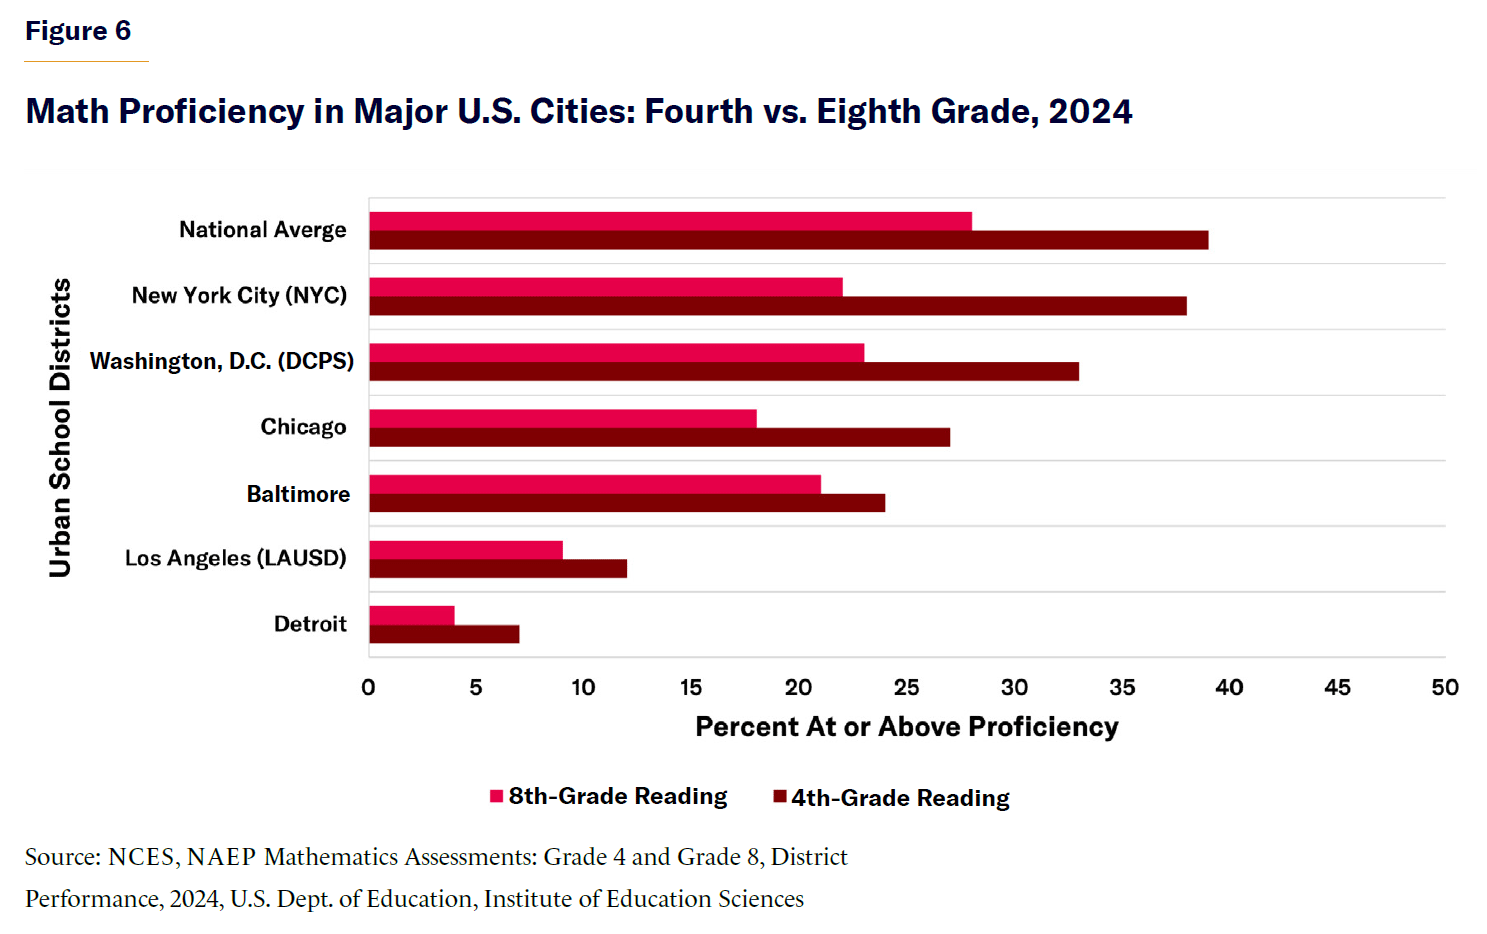
Urban school districts highlight disparities in student achievement. In cities like Washington, D.C., New York, Chicago, Los Angeles, and Houston, reading (Figure 5) and math (Figure 6) proficiency have remained below 30% for the past two decades. I will expand on two of these major metro centers here.
Washington, D.C. (DCPS), was the only major system to exceed national proficiency rates in reading and math. In fourth-grade reading, 36% of DCPS students were proficient, surpassing the national average of 31%. DCPS also performed on par with national averages in fourth-grade math (38% vs. 39%). However, DCPS is still behind many state averages. Its eighth-grade math proficiency was 22%, compared with 28% nationally. These results suggest that while DCPS shows that urban districts can make gains, challenges remain in sustaining long-term improvement.
New York City (NYC), the nation’s largest urban district, continues to struggle with low proficiency rates in reading and math despite decades of reform efforts and the highest per-pupil spending in the country.[8] Only 28% of NYC’s fourth-graders are proficient in reading, compared with 31% nationally. In math, fourth-grade proficiency is 33%, behind the national average of 39%, while eighth-grade math proficiency is just 23%, well below the 28% national rate. NYC represents failures in effective accountability measures and evidence-based instructional models that could have improved student academic performance. NYC also reflects the broader systematic failures of bureaucratic governance in urban public schools.
Racial Trends
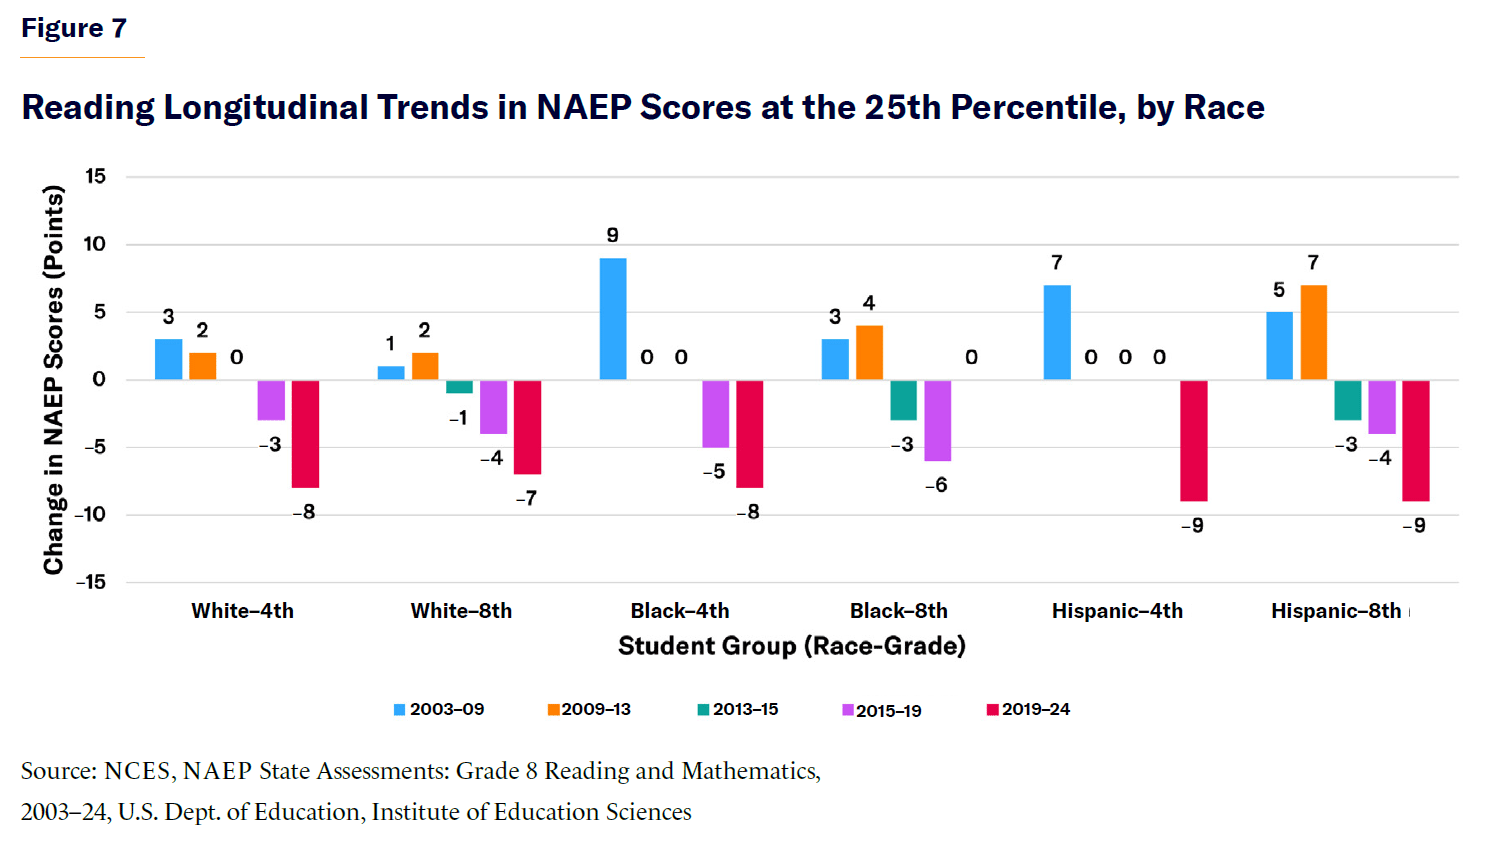
Racial achievement gaps persist across urban, suburban, and rural schools. NAEP data show how federal policies have contributed to the shape of student outcomes, particularly among black and Hispanic students at the 25th percentile. Figures 7 and 8 show the disappointing trends.
During NCLB (2003–13), black and Hispanic students made gains in reading and math, even outperforming gains achieved by white students in many areas. These improvements were most substantial in fourth grade, where black students gained 9 points in reading and 6 points in math, while Hispanic students saw 7-point and 6-point increases, respectively. Eighth-grade trends followed a similar trajectory, narrowing as accountability-driven reforms took hold.
Progress stalled between 2009 and 2013, as the early implementation of Common Core led to instructional inconsistencies. Black students showed little to no growth in reading; and although Hispanic students saw small math gains, overall momentum faded. By 2013–15, early declines were emerging as Common Core was fully implemented. Eighth-grade reading proficiency began to drop across all racial groups, and math scores showed stagnation, signaling a weakening of prior academic progress.
After 2015, with the introduction of ESSA and the removal of federal accountability mandates, declines became more pronounced. Between 2015 and 2019, black students lost 5 points in fourth-grade reading and 6 points in eighth-grade reading, with Hispanic and white students also seeing declines. While initially stable, math scores began to deteriorate among historically disadvantaged students.
Between 2019 and 2024, student achievement continued to decline, with significant losses exacerbated by disruptions from Covid-19. In fourth-grade reading, scores dropped across all racial groups: black students saw an 8-point decline, Hispanic students a 9-point drop, and white students also decreased by 8 points. Math scores showed even more decreases, with black students plummeting by 9 points, Hispanic students by 12 points, and white students by 8 points. These declines highlight the impact of removing structured accountability measures under ESSA, disproportionately affecting the lowest-performing students.

Traditional Public Schools vs. Charter Schools
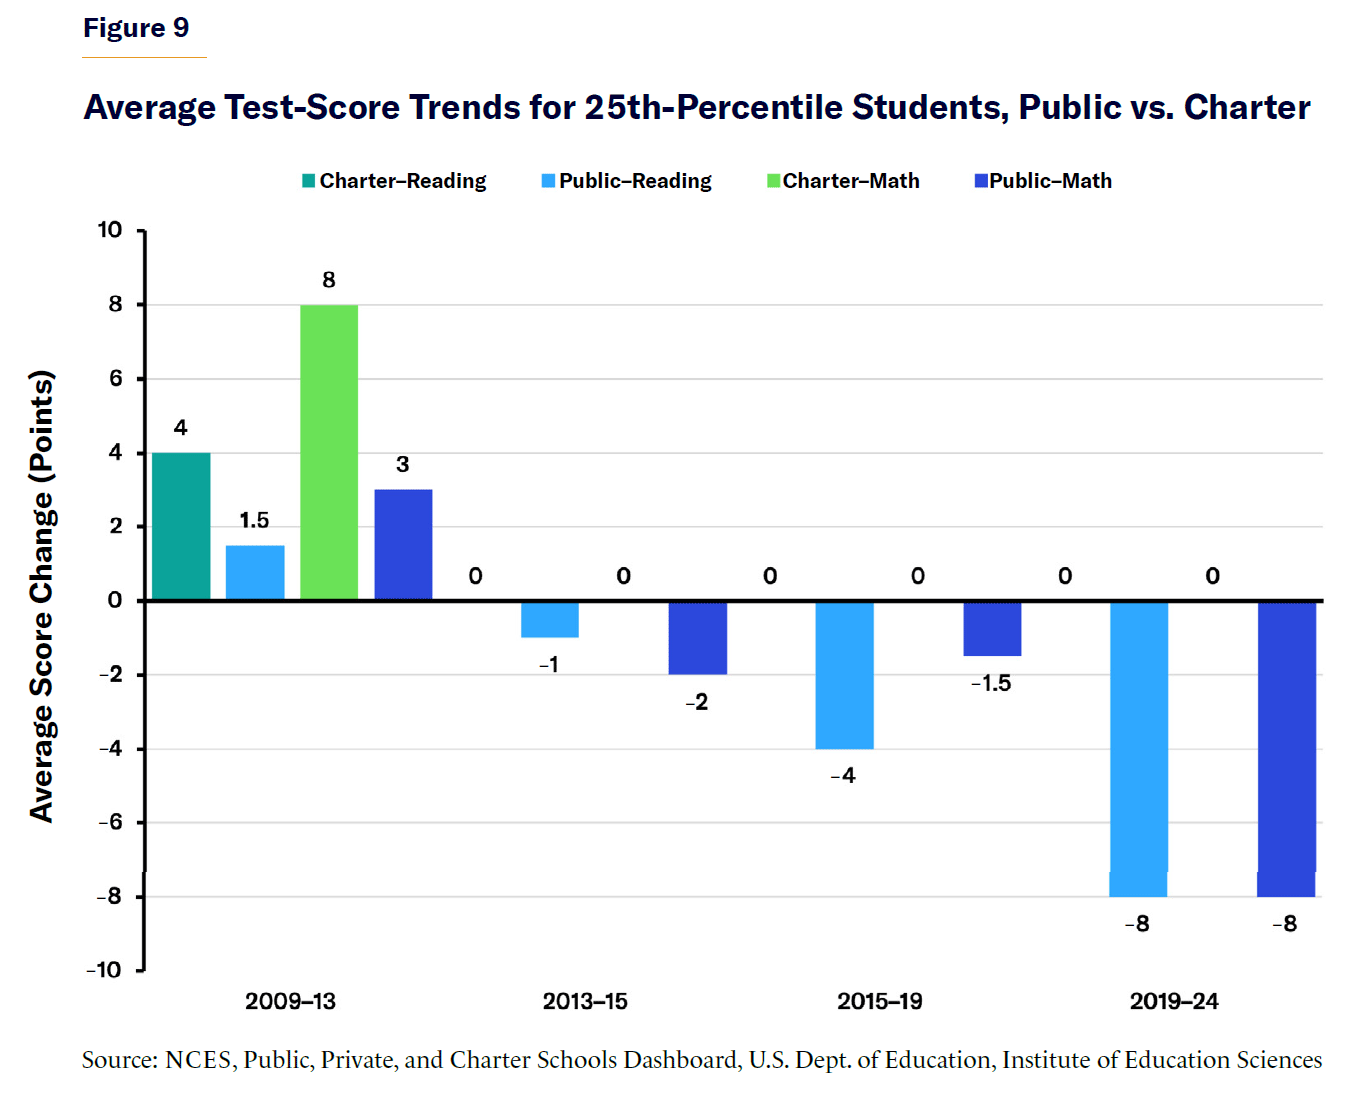
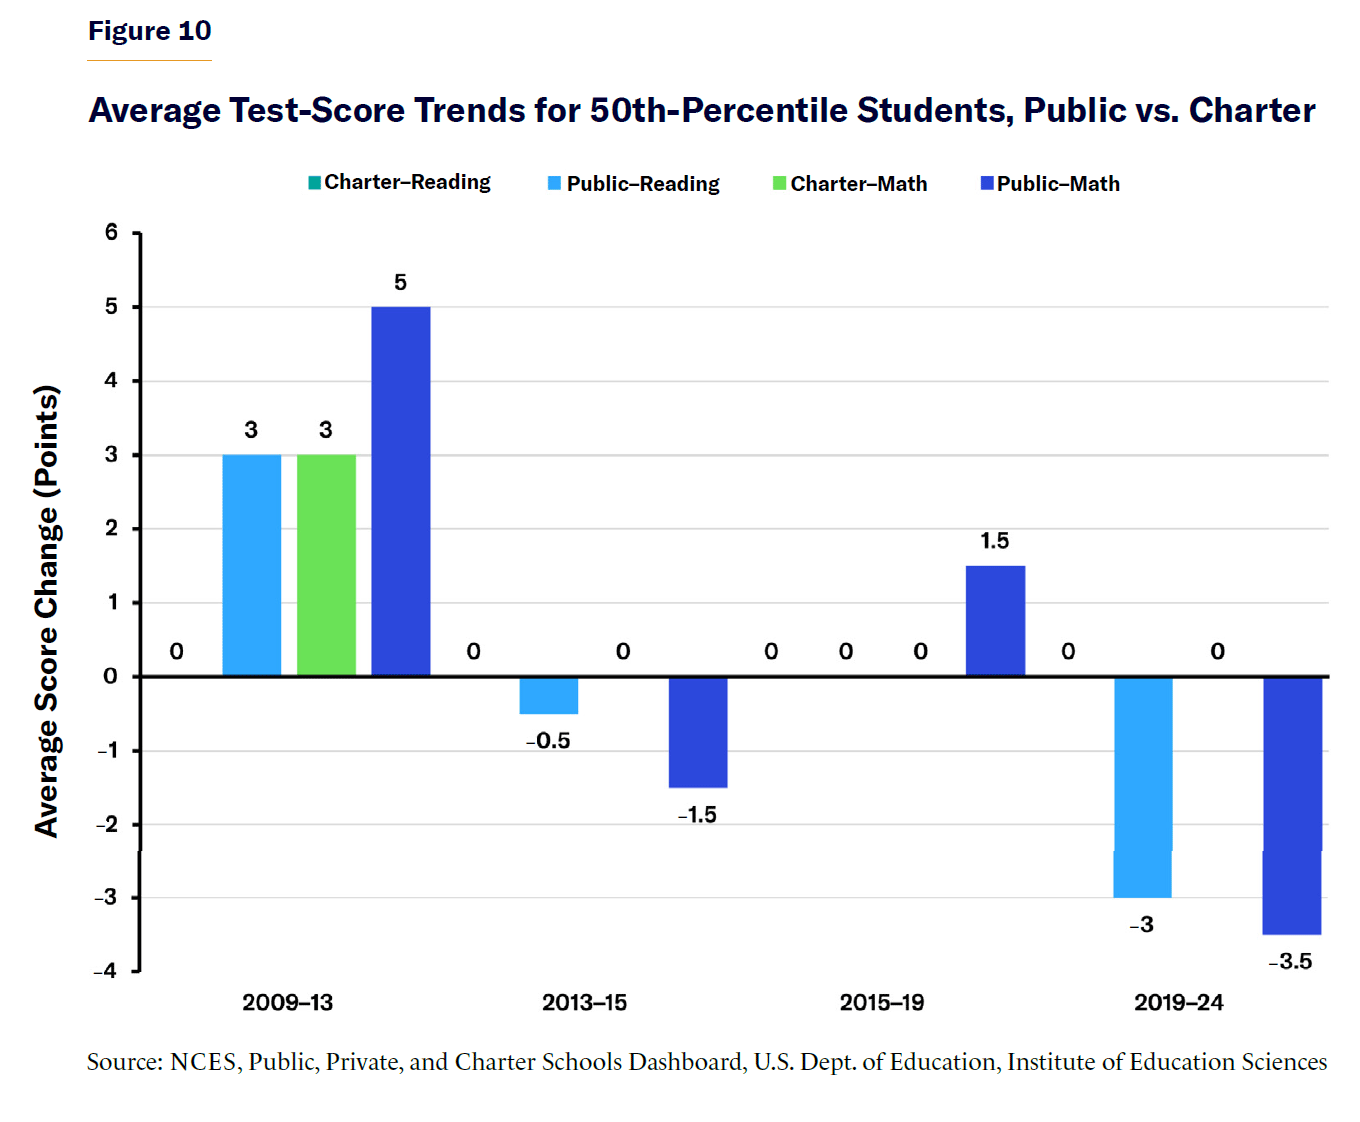
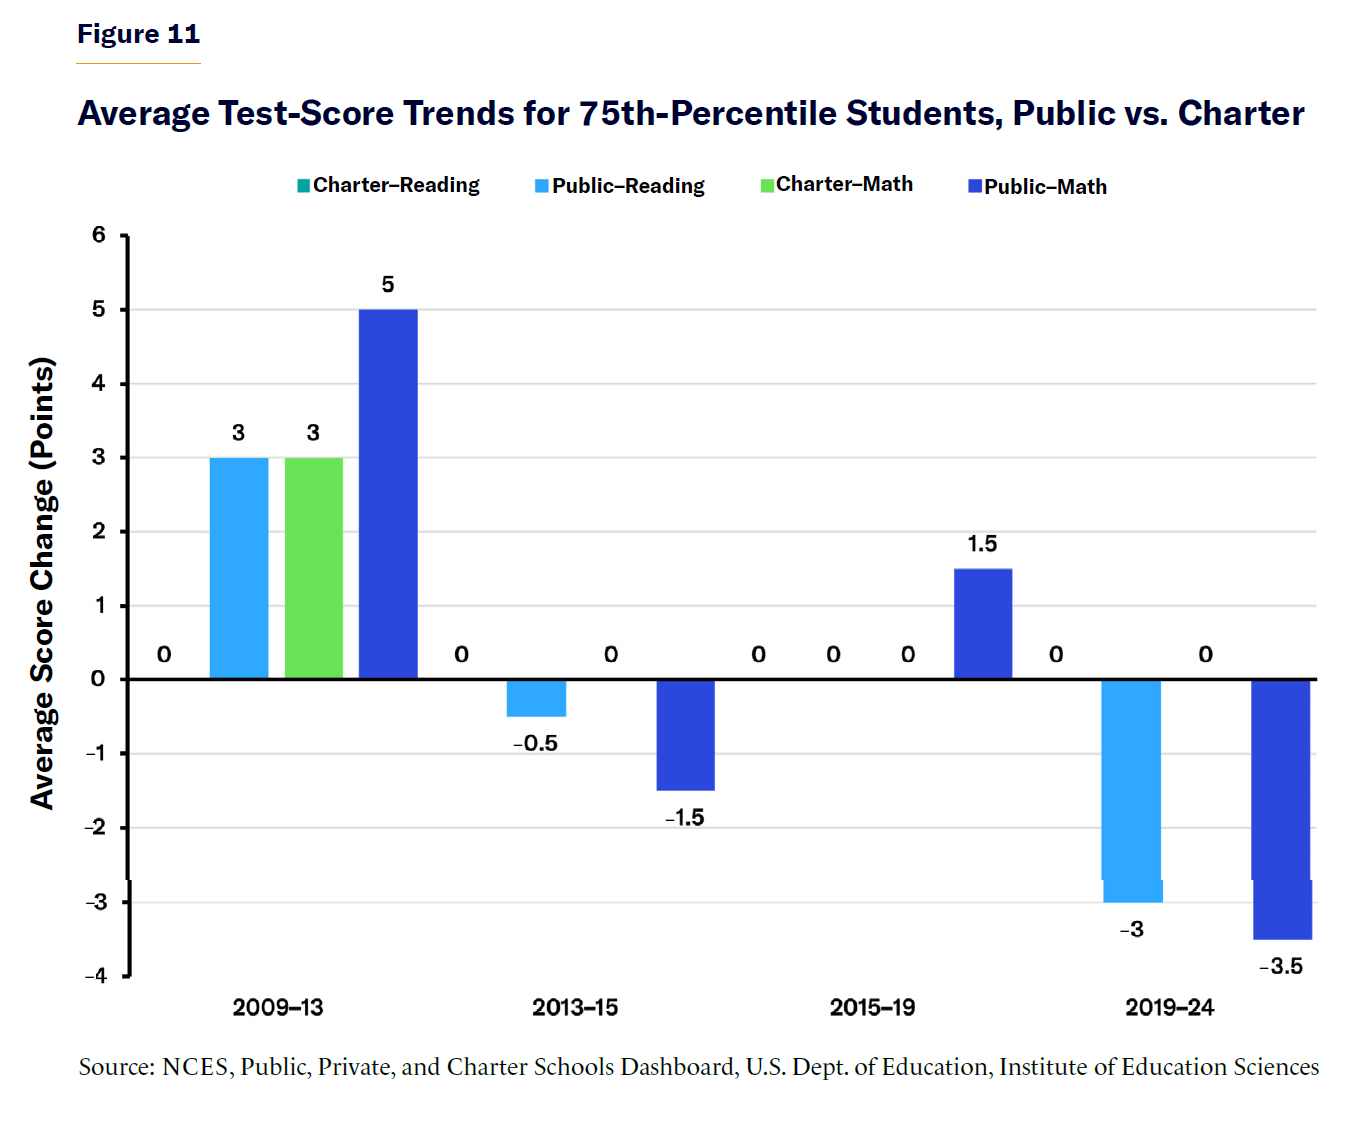
Although racial achievement gaps can be seen across schools and education systems, the type of school a student attends plays a role in academic stability and proficiency. Charter schools have largely maintained steady performance, while traditional public schools, especially those serving the lowest-performing students, have seen declines. The average gains and losses in scores for students at the 25th, 50th, and 75th percentiles in both public and charter schools are shown in Figures 9–11. Again, the removal of accountability measures under ESSA and disruptions from Covid-19 appear to have further accelerated learning loss, with public school students at the 25th percentile experiencing the sharpest declines.[9]
NAEP reading and math data highlight this contrast. Under NCLB (2003–13), 25th-percentile public school students made some gains. However, following Common Core implementation (2013–15) and the era of ESSA (2015–19), performance stagnated and declined. By 2019–24, 25th-percentile public school students had lost an average of 8 points for reading and math. Even higher-achieving students at the 75th percentile were affected, with eighth-grade math scores dropping an average of 7 points during the same period.
In contrast, charter schools largely avoided these losses. From 2013 to 2024, 25th-percentile charter school students saw little to no decline in reading or math. Even at the 75th percentile, charter students remained stable, while public school students continued to show loss. These trends were also reflected among average students (50th percentile), though the declines were less severe. Analysis of the NAEP data reveals that public schools showed academic loss across all percentiles, whereas charter schools showed stability across these periods. The data show systemic issues hindering student achievement in public education. Policy shifts and weakened accountability almost certainly contributed to this decline. Charter school data strongly suggest that they provided a more consistent and stable academic environment despite changes in federal policies and environmental factors.
Collective Bargaining and Student Proficiency
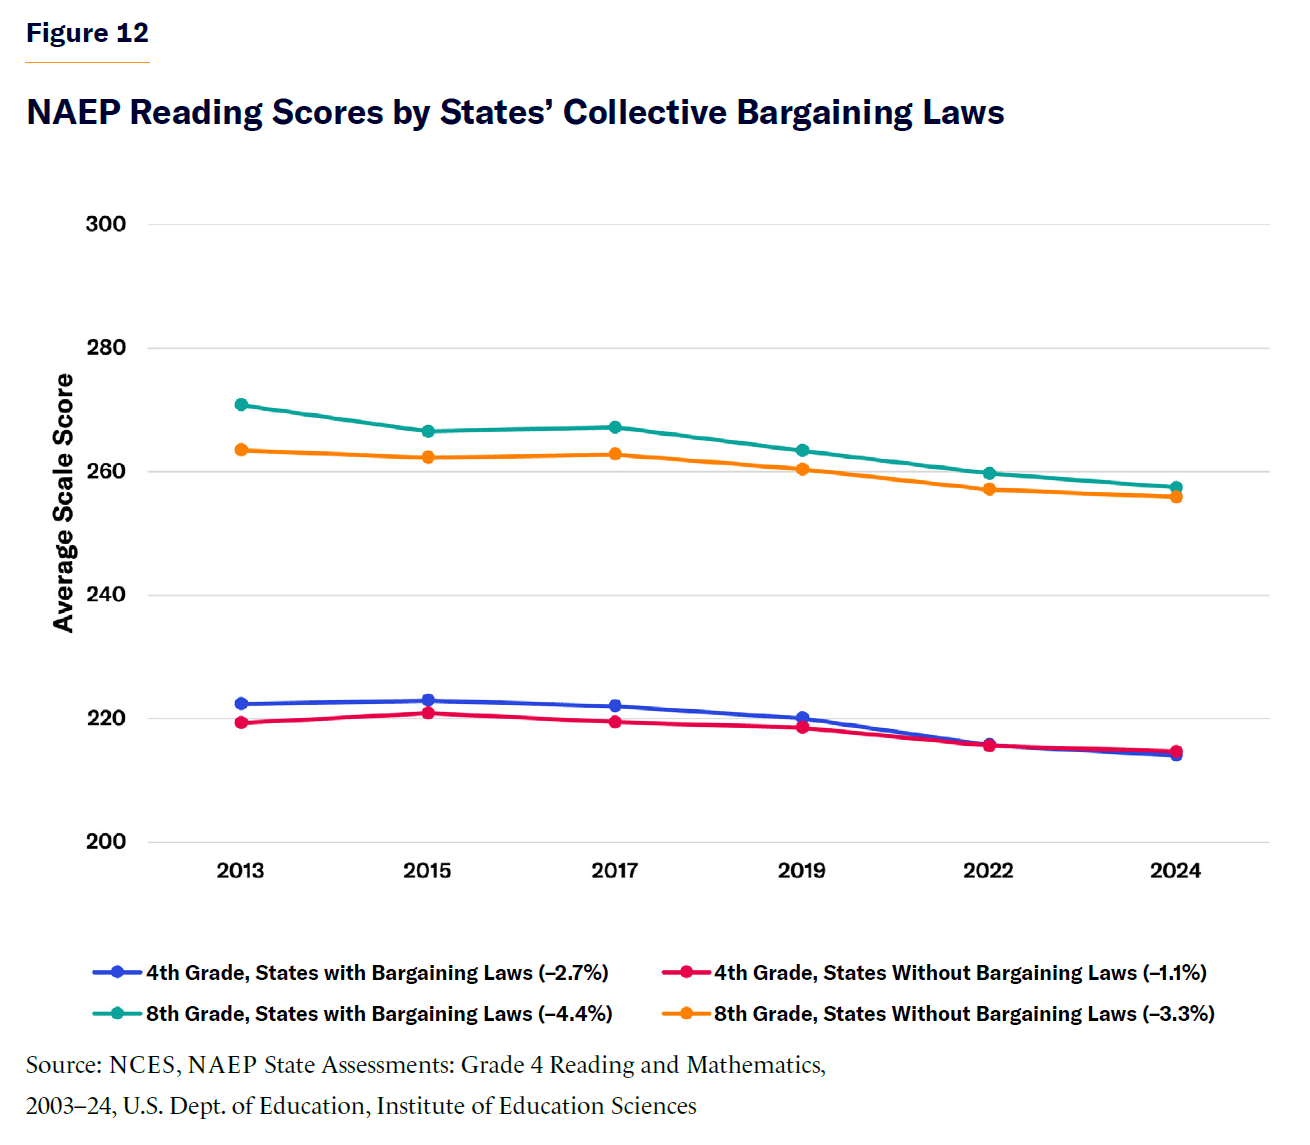
The role of collective bargaining in education policy has been widely debated. Supporters say that these laws protect teachers’ job security and ensure fair pay, while critics argue that they create barriers to instructional reform and impede efforts to meet student needs. My analysis of NAEP data during 2013–24 shows that states with collective bargaining laws experienced larger declines in reading and math compared with states without them since 2013. Specifically, 88% of bargaining-law states saw declines in reading and 79% in math, versus 68% and 56% in states without such laws.
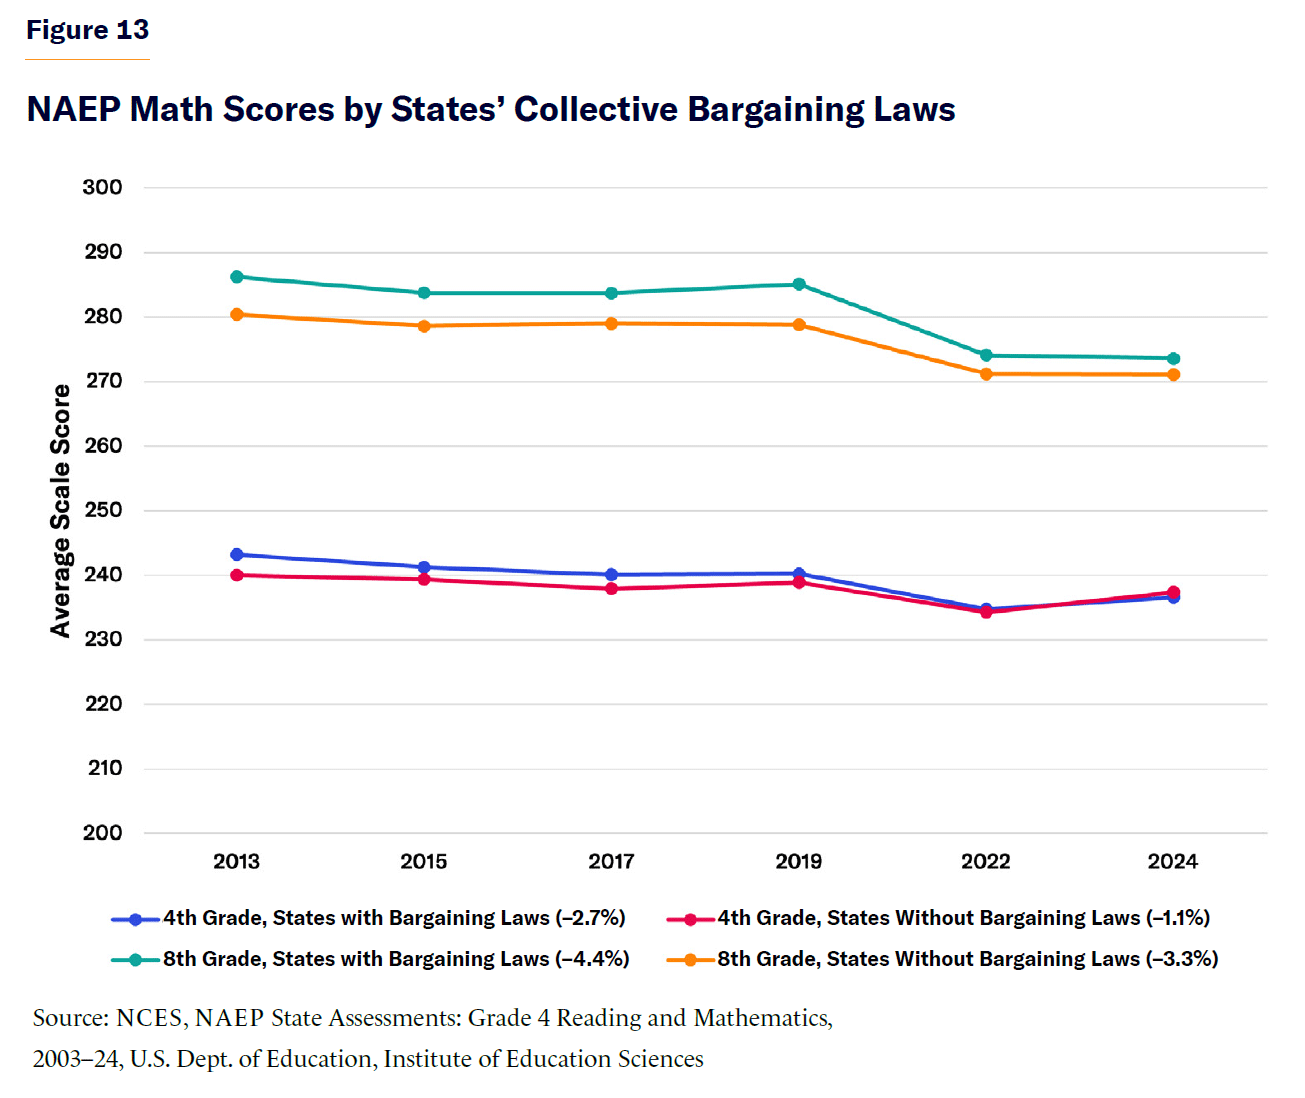
Specifically, in reading, states with collective bargaining laws saw a 3.7% decline in fourth-grade scores and a 4.9% decline in eighth-grade scores, compared with 2.1% and 2.9% declines in non-collective bargaining states. In math, collective bargaining states saw a 2.7% decline in fourth-grade scores and a 4.4% decline in eighth-grade scores, compared with 1.1% and 3.3% declines in non-collective bargaining states (Figures 12 and 13). Although states without collective bargaining laws tended to have lower overall scores at the start of the period in 2013, the rate of decline was significantly larger for states with collective bargaining. This suggests that while these policies provide job security, they may also limit the ability of schools to make necessary instructional changes to sustain student achievement. Of course, correlation does not imply causation. States with collective bargaining laws may have other policy differences contributing to these declines. More research is needed to determine the direct impact of collective bargaining restrictions. Still, the trend suggests that labor policies should be reassessed to ensure that they support—rather than hinder—efforts to improve student academic outcomes.
Table 1
| States with Bargaining Laws | States Without Bargaining Laws |
| Alaska | Alabama* |
| California | Arizona* |
| Connecticut | Arkansas |
| Delaware | Colorado* |
| Florida | Georgia |
| Hawaii | Kentucky* |
| Idaho | Louisiana* |
| Illinois | Mississippi |
| Indiana | North Carolina |
| Iowa | South Carolina |
| Kansas | Tennessee* |
| Maine | Texas |
| Maryland | Utah* |
| Massachusetts | Virginia* |
| Michigan | West Virginia* |
| Minnesota | Wyoming* |
| Missouri | |
| Montana | |
| Nebraska | |
| Nevada | |
| New Hampshire | |
| New Jersey | |
| New Mexico | |
| New York | |
| North Dakota | |
| Ohio | |
| Oklahoma | |
| Oregon | |
| Pennsylvania | |
| Rhode Island | |
| South Dakota | |
| Vermont | |
| Washington | |
| Wisconsin |
*States with limited bargaining laws, where bargaining is not required or is significantly restricted, are grouped with states without bargaining laws. These laws limit bargaining in practice and are grouped with states without bargaining rights.
The Role of Education Funding
The 2024 NAEP results challenge the idea that increased funding results in better academic outcomes. Some of the highest-funded states remain the lowest academic performers. Despite billions of dollars in federal, state, and local education spending, student performance has stagnated or declined, raising critical questions about how funds are allocated and whether accountability measures influence their effectiveness.
New York has the highest per-pupil spending of any state, at $36,293 per student,[10] but only 31% of fourth- and eighth-grade students read proficiently.[11] If spending alone determined success, these students would lead the nation. Instead, these results highlight the failure of high-expenditure education systems and the need for accountability-driven policies. By contrast, California spends significantly less per pupil, at $20,855,[12] but does not perform much worse than New York. According to the report card, 29% of fourth-grade and 28% of eighth-grade students were proficient in reading.[13] This shows that funding alone does not influence student achievement.
One exception is Massachusetts ($21,855 per student),[14] which consistently ranks among the top-performing states, with 40% reading proficiency in grades four and eight.[15] Unlike other high-spending states, Massachusetts pairs its funding with rigorous standards and strong accountability measures.[16] This highlights that funding is essential when paired with strong education policies—but spending alone does not guarantee improvement. If funding alone determined student success, states like New York would lead in performance; yet they do not. This suggests that how education dollars are allocated matters more than the amount spent.
Recommendations and Conclusion
The 2024 NAEP results confirm that there is a decades-long crisis in American education. Federal intervention has failed, increased spending has resulted in no quantifiable improvement, and declining accountability has led to proficiency stagnation and decline. The most significant losses occurred among historically disadvantaged students—mainly black and Hispanic children, who initially benefited from structured accountability policies but experienced the most significant declines when those policies were weakened and schools and teachers were made less accountable for their education outcomes.
Major education initiatives over the past two decades, including NCLB, Common Core, and ESSA, were intended to improve student achievement. However, NAEP data show that these policies produced inconsistent results. The most positive gains occurred under NCLB’s structured accountability model, and the most significant declines followed the adoption of Common Core and ESSA. NCLB implemented standardized testing and accountability measures, which resulted in gains for historically disadvantaged students. Black and Hispanic students also saw faster progress in reading and math under NCLB’s structured interventions. However, introducing Common Core standards in 2010 marked a shift away from direct accountability. By prioritizing a standardized curriculum while simultaneously reducing academic benchmarks, NAEP data show that previous gains stagnated and racial achievement gaps widened.
ESSA further weakened accountability by eliminating federal proficiency mandates and replacing them with unclear state-defined “growth” models. This shift correlated with a nationwide decline in student performance, particularly among the lowest-achieving students. Finally, Covid-19 only worsened these trends, causing historical learning loss, particularly for students in the 25th percentile, who saw record declines in math and reading.
Given this background and the results of the Nation’s Report Card, at least four approaches can reverse the decline and improve the performance of American schoolchildren:
First, reinstitute accountability through mayoral control.
Mayors used to have more control over public schools in their communities than they do today.[17] In the 1990s, about two dozen major cities (which included some of the nation’s largest school districts) gave their mayors direct control of schools. They served as counterweight to teachers’ unions and preexisting educational bureaucracies. Though this system has fallen out of favor among education policymakers, it should be reconsidered. Strong accountability measures within mayoral control are critical to improving student outcomes. Mayoral control can provide centralized oversight and more efficient decision-making, but its success depends on the strength of its accountability systems. While flexibility at the state and district levels is important, schools need clear benchmarks and performance evaluations to stay transparent and accountable to student needs. And they need an influential, publicly accountable figure, like a mayor, to keep attention on them. Strong accountability should prioritize academic proficiency, school performance, and teacher effectiveness. They must ensure that local control of schools drives student progress rather than allowing stagnation. Strengthening data transparency, structured interventions, and proficiency-based reporting can enhance accountability under mayoral control without reverting to the bureaucratic inefficiencies that have previously failed students.
Second, don’t misidentify the problem.
The percentage of students receiving special-education services and resources has exploded. Between the 2000–01 and the 2021–22 school years, 38 states saw an increase in their reported disabled student population.[18] In 2024, the Centers for Disease Control reported that more than 11% of American children had been diagnosed with ADHD, a record-high figure. For 14-year-old boys, the figure was 21%.[19]
These examples are concerning figures. However, accountability must be focused on improving instruction rather than obscuring the problem by possibly misidentifying students as having disabilities.[20] Too often, students who struggle academically are wrongly classified as having a learning disability when the real issue lies in gaps in instruction or the lack of appropriate interventions. A model for elementary schools, the Multi-Tiered System of Support (MTSS),[21] was designed over the last few decades to ensure that students who fell behind received research-based interventions. MTSS is intended to provide individualized support to students to improve positive school experiences and decrease negative educational outcomes. Ideally, students having difficulty in the classroom would receive different levels of personalized support, depending on their needs.[22] Unfortunately, implementation across districts was inconsistent. States need to adopt clear policies requiring proven intervention strategies before considering special-education referrals. Schools must be required to use structured interventions, monitor student growth transparently, and implement clear exit criteria for students who improve. These measures give struggling students the best opportunity to reach grade-level proficiency rather than be misidentified as having learning disabilities.
Third, release the data.
Data transparency is crucial. Publicly reporting school performance and teacher effectiveness ensures accountability. Without transparency, underperforming schools can hide low achievement using vague metrics. Publicly accessible performance data guarantee that teachers and administrators have a clear picture of their starting point and measurable goals for the future, and parents and communities can advocate for necessary improvements and hold educators accountable for student achievement. Additionally, connecting school funding to performance, rather than automatic budget increases secured by policymakers, ensures that resources are directed toward schools that produce measurable results. This approach removes any financial incentive for schools to enhance instruction, close achievement gaps, or prioritize academic proficiency. Money alone cannot lead to improved student achievement. If school funding is directly tied to measurable student performance outcomes, policymakers can incentivize high-performing districts while requiring intervention and restructuring for failing schools.
Parents should have access to their children’s education regarding curriculum, school budgets, and student assessment data. A lack of transparency prevents families from making informed decisions and removes failing schools from accountability. For example, Florida’s Parental Rights in Education Act informs parents about instructional materials and curriculum changes.[23] All states should require school districts to make curricula, budgets, and assessment reports publicly available. Parents should be able to easily access information about their children’s learning, how school funds are allocated, and whether students meet proficiency standards.
Fourth, embrace educational freedom and choice.
School choice provides families with an escape from failing public schools by giving them access to higher-quality educational options.[24] Policies like vouchers, Education Savings Accounts (ESAs), and open enrollment allow students to seek better instruction outside their assigned districts. Since Covid, the number of states with ESAs or similar has gone from five to 19, and more are likely to follow.[25] This flourishing of school choice options should be accompanied by accountability-based policies that set measurable academic benchmarks and track student proficiency. Returning to proficiency-based accountability measures and strengthening teacher effectiveness would supplement school choice initiatives, ensuring that public and private options lead to results. School choice policies should expand to include ESAs and open enrollment programs, so that families have options beyond their assigned districts.
Some states have already put these reforms into action. Florida has expanded school choice using a data-driven grading system to strengthen accountability.[26] Arizona has grown its ESA program, giving families more control over their children’s education.[27] Texas’s dual enrollment and accountability-driven interventions have shown increases in student access to college-level coursework,[28] which has increased student readiness for postsecondary education. These models show how structured interventions, transparent reporting, and performance-driven policies can lead to measurable improvements in student outcomes.
The 2024 NAEP results should be a wake-up call to American educators and policymakers: student achievement will continue to decline without restoring accountability, prioritizing evidence-based instruction, and ensuring that families have real education choices. While local control provides flexibility in education policies, it must be paired with strong accountability measures to prevent continued stagnation and failure. Policymakers must focus on ensuring measurable academic improvements through structured interventions, transparent reporting, and performance-driven funding. Only by prioritizing student outcomes over bureaucratic expansion can the nation’s education system get back on track.
Endnotes
Photo: Jeffrey Coolidge / Corbis via Getty Images
Are you interested in supporting the Manhattan Institute’s public-interest research and journalism? As a 501(c)(3) nonprofit, donations in support of MI and its scholars’ work are fully tax-deductible as provided by law (EIN #13-2912529).


