The Supplemental Nutrition Assistance Program (SNAP) is the largest federal food assistance initiative in the U.S., supporting roughly one in eight Americans. The program helps low-income households purchase groceries, with monthly benefits averaging around $180 per person nationwide.
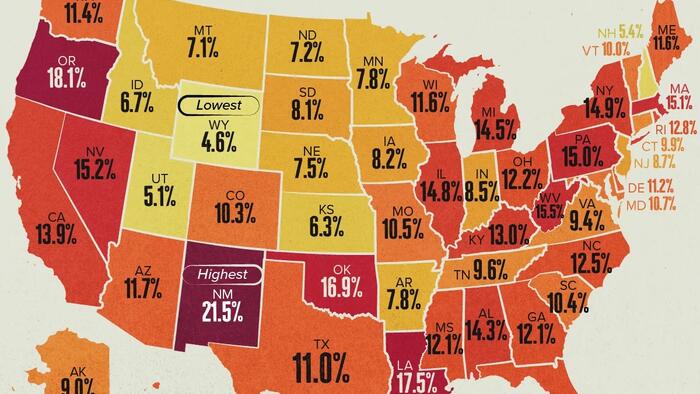
This visualization, via Visual Capitalist’s Bruno Venditti, highlights the states most reliant on food stamps, based on 2025 data from SmartAsset. While participation rates vary widely, the figures reveal stark contrasts in economic need and cost of living across states.

New Mexico Leads in SNAP Dependence
New Mexico stands out as the most SNAP-dependent state, with 21.5% of residents receiving assistance, nearly double the national average. The average monthly benefit there is $176.51 per person, totaling over $80 million in monthly aid. Persistent poverty rates and rural isolation help explain the state’s high reliance on federal food assistance.
Oregon follows closely at 18.1% enrollment, while Louisiana ranks third at 17.5%. In each case, elevated unemployment and cost pressures have contributed to continued demand for benefits.
Coastal and Urban States See Higher Benefit Amounts
States like New York ($218.44), Massachusetts ($215.64), and Hawaii ($361.78) report some of the highest average benefits per person. These higher payments reflect steeper living costs in dense urban and island economies.
| Rank | State | Population with SNAP | Avg benefit per person | Number of beneficiaries | Total monthly benefits |
|---|---|---|---|---|---|
| 1 | New Mexico | 21.5% | $176.51 | 457,699 | $80,790,060 |
| 2 | Oregon | 18.1% | $182.17 | 772,893 | $140,797,421 |
| 3 | Louisiana | 17.5% | $186.90 | 803,988 | $150,268,544 |
| 4 | Oklahoma | 16.9% | $186.85 | 692,477 | $129,386,266 |
| 5 | W. Virginia | 15.5% | $167.74 | 273,566 | $45,886,908 |
| 6 | Nevada | 15.2% | $171.80 | 496,848 | $85,360,880 |
| 7 | Massachusetts | 15.1% | $215.64 | 1,076,187 | $232,066,810 |
| 8 | Pennsylvania | 15.0% | $181.70 | 1,958,047 | $355,777,154 |
| 9 | New York | 14.9% | $218.44 | 2,962,913 | $647,210,404 |
| 10 | Illinois | 14.8% | $195.94 | 1,879,564 | $368,278,250 |
| 11 | Michigan | 14.5% | $175.44 | 1,473,832 | $258,575,524 |
| 12 | Alabama | 14.3% | $193.08 | 736,178 | $142,142,795 |
| 13 | California | 13.9% | $190.25 | 5,494,318 | $1,045,310,679 |
| 14 | Kentucky | 13.0% | $178.94 | 595,155 | $106,498,834 |
| 15 | Rhode Island | 12.8% | $200.95 | 142,726 | $28,680,737 |
| 16 | Florida | 12.6% | $181.97 | 2,943,012 | $535,551,777 |
| 17 | North Carolina | 12.5% | $174.75 | 1,378,291 | $240,858,724 |
| 18 | Ohio | 12.2% | $186.03 | 1,450,955 | $269,917,495 |
| 19 | Georgia | 12.1% | $186.08 | 1,356,493 | $252,417,633 |
| 20 | Mississippi | 12.1% | $180.46 | 357,042 | $64,432,174 |
| 21 | Arizona | 11.7% | $182.25 | 887,253 | $161,705,602 |
| 22 | Maine | 11.6% | $176.55 | 163,520 | $28,869,975 |
| 23 | Wisconsin | 11.6% | $163.89 | 689,315 | $112,973,934 |
| 24 | Washington | 11.4% | $184.51 | 905,471 | $167,068,578 |
| 25 | Hawaii | 11.3% | $361.78 | 163,576 | $59,178,123 |
| 26 | Delaware | 11.2% | $180.54 | 118,209 | $21,340,950 |
| 27 | Texas | 11.0% | $177.82 | 3,455,085 | $614,386,464 |
| 28 | Maryland | 10.7% | $182.49 | 667,981 | $121,902,010 |
| 29 | Missouri | 10.5% | $196.10 | 655,940 | $128,629,589 |
| 30 | South Carolina | 10.4% | $186.42 | 567,895 | $105,867,349 |
| 31 | Colorado | 10.3% | $195.97 | 614,843 | $120,493,408 |
| 32 | Vermont | 10.0% | $188.75 | 64,633 | $12,199,424 |
| 33 | Connecticut | 9.9% | $192.89 | 363,524 | $70,118,853 |
| 34 | Tennessee | 9.6% | $203.20 | 690,545 | $140,318,213 |
| 35 | Virginia | 9.4% | $173.84 | 824,866 | $143,392,688 |
| 36 | Alaska | 9.0% | $364.31 | 66,377 | $24,181,479 |
| 37 | New Jersey | 8.7% | $194.63 | 826,094 | $160,778,766 |
| 38 | Indiana | 8.5% | $195.71 | 586,403 | $114,763,019 |
| 39 | Iowa | 8.2% | $169.04 | 267,158 | $45,159,537 |
| 40 | South Dakota | 8.1% | $198.24 | 75,282 | $14,923,544 |
| 41 | Minnesota | 7.8% | $158.45 | 451,966 | $71,616,027 |
| 42 | Arkansas | 7.8% | $172.82 | 239,748 | $41,434,391 |
| 43 | Nebraska | 7.5% | $181.00 | 150,600 | $27,258,920 |
| 44 | North Dakota | 7.2% | $174.33 | 57,129 | $9,959,141 |
| 45 | Montana | 7.1% | $170.68 | 80,523 | $13,743,731 |
| 46 | Idaho | 6.7% | $179.01 | 133,545 | $23,906,189 |
| 47 | Kansas | 6.3% | $177.23 | 186,036 | $32,971,957 |
| 48 | New Hampshire | 5.4% | $169.56 | 75,717 | $12,838,748 |
| 49 | Utah | 5.1% | $192.17 | 177,087 | $34,030,139 |
| 50 | Wyoming | 4.6% | $183.81 | 27,122 | $4,985,385 |
In contrast, benefits tend to be smaller in lower-cost Midwestern states such as Wisconsin ($163.89) and Minnesota ($158.45), where overall food prices and housing costs are lower.
Low Participation in Western States
Wyoming has the lowest SNAP participation rate at just 4.6%, followed by Utah (5.1%) and New Hampshire (5.4%). Still, even in these states, food stamps remains a crucial safety net for tens of thousands of residents. Utah alone distributes more than $34 million in benefits each month to about 177,000 people.
If you enjoyed today’s post, check out The Longest Government Shutdown in U.S. History on Voronoi, the new app from Visual Capitalist.
Loading recommendations…