
The yield on the 30-year US Treasury bond just crossed the 5.0% mark for the first time in 17 years. So it might be useful to revisit where we have been lo these many decades.
We are referring to the long bond’s utterly fabricated 54 year journey since the Camp David event in August 1971. By our reckoning, the latter provides proof positive that the Donald’s blunderbuss attack on the Fed is fully warranted and that his negative characterization of its competence is absolutely correct.
To wit, Jay Powell and the whole parade of Keynesian central bankers who came before him—save for William McChesney Martin and Tall Paul Volcker—were neither competent nor deserving of the Fed’s vaunted “independence”. Indeed, you could have gotten a better result from a posse of random names snatched out of the Cleveland phone book—which is to say, from the nation’s vast private markets in interest rates, stock, bonds, derivatives and other financial assets.
The real import of the Donald’s current attack on Powell, therefore, is not actually about his cockamamie judgement that the Fed funds rate should be 300 basis points lower at this particular point in time. The real gravamen of Trump’s complaint is that the Fed should not even be fiddling with the rate on overnight money or the level and shape of the entire debt market yield curve in the first place.
In fact, neither the 12 men/women on the FOMC, nor the one man or woman who is temporarily domiciled in the Oval Office each four years nor the clown car battalions on Capitol Hill who mostly spend a lifetime there, are competent to set interest rates. That’s a job for free, flexible, dynamic, competitive, information-rich private markets, not an agency of the state. Full stop.
The evidence for that proposition is that the Fed has been dead wrong about the long-term interest rates for at least the five decades since Nixon manhandled Chairman Arthur Burns into cranking up the Fed’s printing presses in behalf of his 1972 reelection campaign. In short order that brought the demise of the Breton Woods gold exchange system, which was already on its death bed owing to Fed financing during the prior decade of LBJ’s “guns and butter” fiscal extravaganza.
Thereafter, of course, the world entered the era of fiat central bank money, dirty (government manipulated) floats in foreign exchange markets and the financial rule of a few fallible monetary apparatchiks. The latter claimed, of course, to be in the high-minded business of delivering the greater good for all the people as opposed to market-based traders, investors, businesses and other economic players with skin in the game merely attempting to pursue their own selfish good.
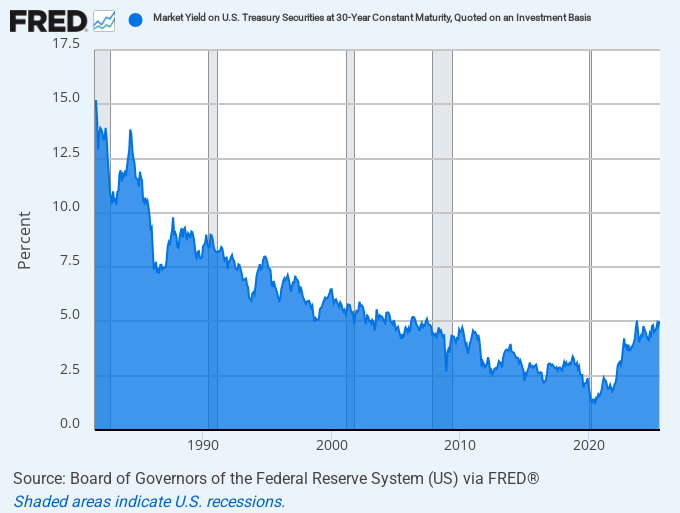
Indeed, the dispositive proof of the generic incompetence of monetary central planners (aka central bankers) is the four decade’s march of the long bond relentlessly down the yield hill as depicted in the graph below. It shows that from the peak of 15.2% in September 1981, to the bottom at 1.20% in March 2022, the long-bond’s yield traversed 1400 basis points of nearly continuous decline. Yet nothing remotely like this 49-year one-way journey could have occurred on the free market operating under a regime of sound money.
To wit, sound money rates would never have been this high in the first place, nor would they have tumbled this low eventually. And that’s to say nothing of a one-way direction of travel the whole time in between. To the contrary, the graph has “central bankers at work” written all over it because the price of bonds (i.e. yields) on the free market would have continuously zigged and zagged in a narrow but directionless range for the entire half century running.
30-Year US Treasury Bond Yield, 1981 to 2025
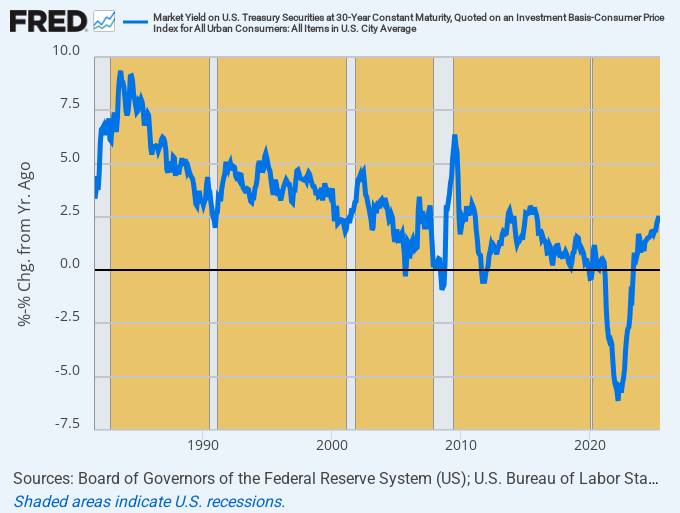
That the above anomalous path was the handiwork of the Fed and its foreign central bank accomplices is further reinforced by the graph below, which extracts CPI inflation on a Y/Y basis from the nominal yield. And on this “real yield” basis, the range is even more stupendously unmarket-like, ranging from a +940 basis points high in June 1983 to a -610 basis points low in March 2022.
Again, that’s 1550 basis points of range variation. Yet baring some unimaginable catastrophe even far worse than the Great Depression of the 1930s, there is simply no scenario—-no imaginable imbalance of supply and demand in the bond pits—so extreme as to generate real yield outcomes this variant.
After all, the real yield is the return needed to cover taxes and the opportunity cost of locking up money (via duration risk) for one-third of a century. There is nothing in the history or logic of finance that suggests that the real interest rate in its natural state would even remotely vary by such extreme magnitudes, and most especially that it would plunge into negative real yield territory at the durations and depths depicted in the graph.
Nevertheless, under the tutelage of the Fed and its fellow-traveling central banks, the pattern below did actually happen. This means, in turn, that current financial investor and trader mindsets and the market’s very internal memory muscles have been profoundly mis-shaped by the 40-year yield slide depicted in the graphs.
Accordingly, we would suggest that the debt markets are just beginning a new price discovery process that incepted in March 2022. That’s when for the first time in a half century the central banks of the world were compelled to shut down their printing presses simultaneously because under the conceit of the “Great Moderation” mantra promulgated by Bernanke in February 2004 the nearly double-digit inflation that peaked in the summer of 2022 was never supposed to happen. So they central bankers panicked and lurched into an anti-inflation mode almost on a dime.
As is also evident in the graph, real yields have consequently sprung-higher by 860 basis points from the March 2022 bottom to a current level of about +2.5%. That’s just 38 months on a new path that is diametrically opposite to that of the prior 40 years.
Undoubtedly, traders trained in the central bank printing press era of the last four decades are expecting only a temporary reversal like all the other minor upward blips shown in the graph. Indeed, their trading charts are geared to issuing “buy signals” at exactly those expected points.
But if the central banks do not restart their printing presses soon, and we believe they will not owing to excess embedded inflation, trading models will issue no buy signals. And, at length, markets will become sorely disappointed, meaning that bond selling will commence at scale as traders and algos pivot to selling that which the central banks are not buying, as opposed to front-running the continuously expanding central bank balance sheets, as they have been doing for decades.
Inflation-Adjusted 30-Year US Treasury Bond Yield, 1981 to 2025
Needless to say, front-running of the central banks by global traders and algos has been a massive, market-driving force in recent decades because the central banks have literally been buying US government issued and guaranteed debt securities hand over fist. In the case of the Fed alone, its balance sheet of mostly US Treasury paper has exploded from $80 billion in June 1971 to the money-printing high of $9.0 trillion in March 2022.
That’s a gain of 113X for anyone keeping score, which, in turn compared to a national income or GDP gain of just 21X during the same 51 year period.
Yet and yet. That’s really not the half of it when you consider the fellow-traveling central banks of the world, which for better or worse responded to the Fed’s flood of dollar liabilities by massive, continuous currency market interventions and “dirty floats”. In turn, these Treasury bond-buying sprees by foriegn central banks were designed to thwart the free market logic of Uncle Milton Friedman and thereby prevent the natural and substantial appreciation of their own exchange rates which would have occurred on an honest free market.
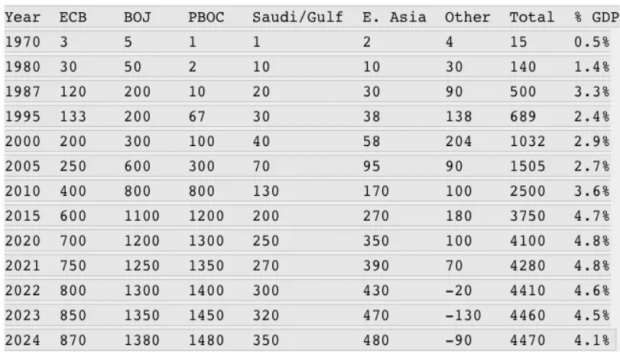
Accordingly, the tiny $15 billion holdings of US Treasury debt by the combined central banks of the world outside of the US in June 1971 soared to $1 trillion by the turn of the century and to a peak of $4.4 trillion by the 2022 top of the central bank money-printing era. In total, therefore, once the central banks were freed from the discipline of fixed exchange rates and gold convertibility in August 1971 it truly was a world of Katie-bar-the-door.
As it happened, US Treasury paper held by the ECB (or its predecessors), the Bank of Japan, the People’s Bank of China, Saudi Arabia and the Gulf Petro-States, South Korea and the other East Asian exporters plus the rest of the world amounted to only 0.5% of world GDP in June 1971.
That is to say, during the shaky final days of the Breton Woods gold standard there was no reason for foreign central banks to own material amounts of the so-called dollar reserve currency. By the time Greenspan got to the Fed in 1987, however, the dirty float game had already developed a goodly head of steam. At that point, the foreign central banks held $500 billion of US Treasury paper, amounting to 3.3% of global GDP.
Thereafter, of course, it was off to the races as Greenspan’s Keynesian Fed cranked up the printing presses, even as foreign banks sopped up a rising share of the increasingly unwanted dollars earned in trade. By the eve of the Great Financial Crisis, therefore, foreign central banks held $1.5 trillion of US government debt, which figure climbed steadily higher thereafter in response to the massive outpouring of dollar liabilities from the Fed and the swelling US trade deficits which resulted from it.
Alas, by the money-printing peak of March 2022, foreign central banks owned $4.4 trillion of US government debt, amounting to 4.7% of global GDP, which had reached nearly $96 trillion.
As is evident from the chart, by 2024 the ECB, Bank of Japan and People’s Bank of China alone held $3.73 trillion of US Treasury debt. It is not surprising, therefore, that in 2024 combined US imports from these three major trading partners totaled $1.256 trillion compared to exports to these countries of just $596 billion, yielding a yawning trade deficit of $600 billion per year.
In short, the debt and inflation-saturated US economy after five decades of money-printing leadership at the Fed is essentially in the business of buying foreign goods and selling Uncle Sam’s debt paper to cover the shortfall.
Global Central Bank Holdings Of US Government Securities, 1970-2024 (billions)
Needless to say, during the same period the Fed’s balance sheet, which is comprised mainly of US government debt and guaranteed agency paper on the asset side, also soared skyward. The Fed’s holding of $80 billion of US Treasury paper in June 1971 had multiplied by a factor of 111X to the aforementioned $9.0 trillion by the March 2022 peak. Relative to national income, the Fed’s balance sheet went from an already bloated (by historic standards) 6.9% of GDP in Q2 1971 to 36% of US GDP by the peak in March 2022.
There should be no mystery, therefore, as to how the inflation bloated yield of 15.2% on the 30-year Treasury Bond in July 1982 marched relentlessly downhill to just 1.2% in March 2022: Namely, the combined central banks of the world had their big fat thumbs on the supply and demand scales in the bond pits of the world like never before imagined.
That is to say, the holdings of the Fed plus the central banks of the world depicted in the table above amounted to just $95 billion in June 1971 and roughly 3.2% of global GDP. By contrast, at the money-printing apotheosis in March 2022, the Fed and its fellow-traveling central banks around the planet held $13.4 trillion of US Treasury debt, which amounted to 14% of global GDP.
In short, the U.S. dollar has not been a “reserve currency” in the classic sense since August 1971. That’s when the world stumbled into purely fiat moneys traded via dirty floats on the world’s exchange markets by central banks eager to counter-act the massive monetary inflation of the Federal Reserve.
That is, foreign central bank holdings of dollar securities were not substitutes for gold as were sterling reserves in the 1920s and dollar reserves under Breton Woods. They were simply the accumulated coin of dirty floats designed to counter the flood of the Fed’s inflationary dollars in the foreign exchange markets.
To be sure, the trick of dirty floats and dollar hoards worked for several decades…..until suddenly it didn’t, doesn’t and won’t for as far as the eye can see in the world ahead. In turn, how the end of global central bank monetization of Uncle Sam’s debt is likely to play out in the years ahead will be the subject of Part 3.
Reprinted with permission from David Stockman’s Contra Corner.


