
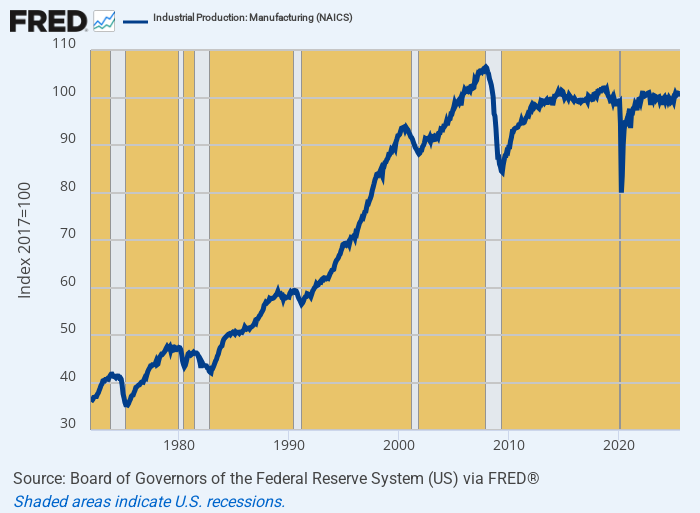
You can bet the 12 purported geniuses on the FOMC, who today came up with a 25 basis point cut in the essentially phony Fed funds rate, have never looked at the graph below. It shows that for all their wild-ass money printing in recent years, the US index of manufacturing output stands at 101.39, which is nearly 5% below the level reached on the eve of the financial crisis in December 2007.
That’s right. The US manufacturing economy has been shrinking in real physical terms for the past 18 years notwithstanding the fact that during that interval the Fed has printed nearly $6 trillion in brand, spanking new money that it snatched from thin air. So something big and bad happened after the Fed went all in on money-printing in response to the stock market meltdown in the fall of 2008.
After all, during the 28 years between 1972 and 2000 the very opposite occurred. Manufacturing output in the US rose by nearly 150%, which computes to a 3.3% growth rate per annum.
Yet there is no mystery as to why manufacturing output abruptly went flatter than a board after the Financial Crisis: To wit, the mad money-printers in the Eccles Building simply inflated the bejesus out of the US economy at a time when what was urgently needed was a stern deflation of an already inflation-bloated industrial sector.
US Manufacturing Output, 1972 to 2025
Here’s the thing. The price of a Pilates studio session or dentist visit is mainly driven by supply and demand balances in local markets, but with today’s shipping and communications technology the manufacture of durable goods is subject to ferocious global competition. Indeed, when you look at the current fully loaded (for fringes and benefits) wage rates among major foreign suppliers, it is no wonder that output of US manufactured goods has flat-lined.
Average Fully Loaded Manufacturing Wages Per Hour in 2024:
- Vietnam: $3.50.
- India: $4.50.
- Mexico: $5.00.
- China:$6.00.
- S. Korea: $20.50.
- Canada: $22.00.
- Japan:$28.00.
- UK: $30.00.
- EU-27: $32.50.
- USA: $44.25
Well, for crying out loud! What’s the mystery?
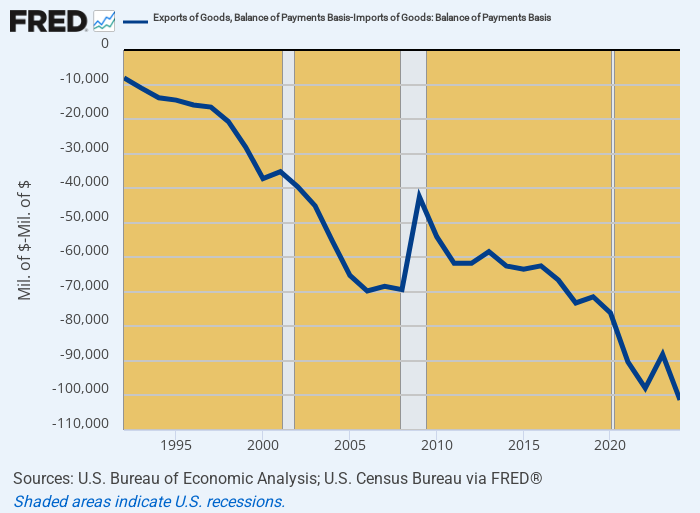
The USA has priced itself out of the global manufacturing market, which is exactly why America has been running chronic and massive trade deficits that reached the staggering annual level of $1.2 trillion in 2024. Indeed, the collapse of America’s trade balance has been relentless over the last 30 years—with the deficit rising by 10X, from $10 billion to $100 billion. Per month!
And, no, POTUS, foreign trading partners did not suddenly turn into ever worsening unfair trade cheats in the last three decades. The cause of the plunging line below is domiciled on the banks of the Potomac, not in foriegn capitals.
Average U.S. Monthly Trade Deficit, 1992 to 2024
The vast gap between US manufacturing wages and that of our major trading partners has been building relentlessly since the early 1990s when Greenspan put the Fed in the monetary central planning business. Back then, the fully loaded US manufacturing wage was about $18.50 per hour, meaning that it has risen in nominal terms by 2.4X since then.
However, owing to the Fed’s relentless pro-inflation policies the CPI index has risen by 124%, meaning that in 2024 dollars the 1992 fully loaded manufacturing wage was $41.10 per hour. Accordingly, workers who manged to keep their jobs gained barely 7% over one-third of a century from all of the Fed’s pro-inflation money printing, even as the ever rising level of nominal US wages made blue collar workers a sitting duck in global markets. Again, for want of doubt see the gaping fully loaded international manufacturing wage levels in US dollars shown above.
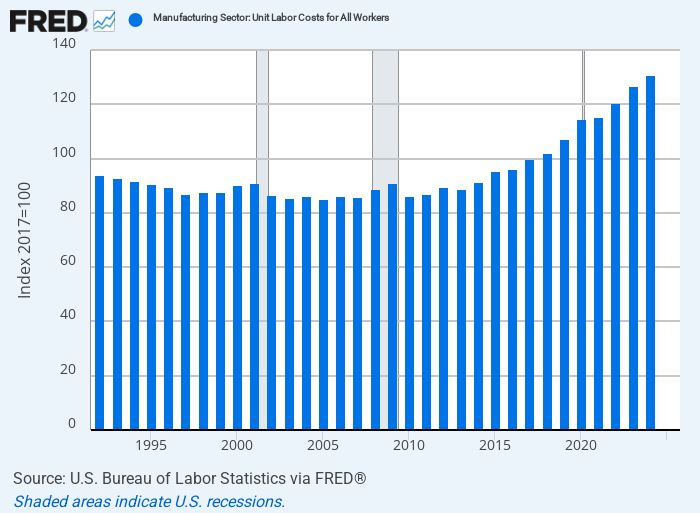
Of course, the Fed’s fanboys on Wall Street say not to worry—productivity gains will offset the nominal wage gains. That was partially true for a few years during the technology-driven productivity boom of the 1990s, but no more. Since 2007 unit labor costs in US manufacturing have soared by +53%, which exactly coincides with the deep plunge in the US trade deficit in goods after the turn of the century.
Index of US unit labor costs in Manufacturing, 1992 to 2024
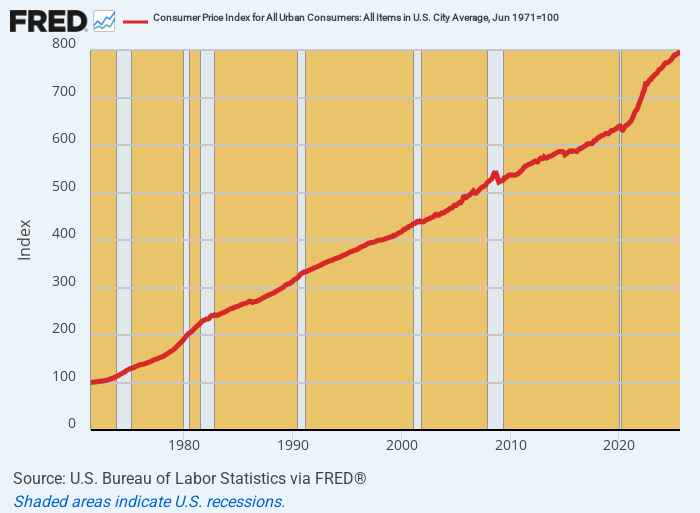
In short, what America really needed from the early 1990s onward, as the China export machine and its worldwide supply chain came to life, was zero inflation at worst and ideally a spell of price, wage and cost deflation to offset the vast ballooning of US production costs after Tricky Dick Nixon severed the dollar’s link to gold in August 1971.
Between that date and mid-1992, the general price level in the US rose by 250%, and now stands at 700% above its June 1971 level. Is there any wonder, then, that the US has priced itself out of the global manufacturing market?
Of course, the sheer monetary insanity depicted by the red line in the graph below is justified by the Fed on the grounds that inflation is good for prosperity—-at least to the extent of 2.00% annually, year in and year out.
Except there is not a shred of historic evidence or sound economic logic to justify the Fed’s sacred 2.00% target. It’s just a handy excuse for running the printing presses at rates which please the gamblers on Wall Street and the Spenders in Washington.
700% Inflation Rise Since June 1971
To return to our opening chart, industrial production is the heart of the modern economy and the main source of sustainable gains in real output and living standards. Even a half-assed assessment of the world in 1990 would have told any honest and capable monetary central planner that wringing out some of the 250% increase in the domestic cost and price level that had accumulated since Camp David was imperative if the US was to remain competitive in global markets.
Alas, the Keynesian fools who took over the nation’s central bank under Greenspan’s leadership cooked-up a closed bathtub style model of the US economy, and conferred upon themselves the Keynesian mission of keep “aggregate demand” full to the brim via low interest rates and massive injections of fiat credits into the nation’s financial markets.
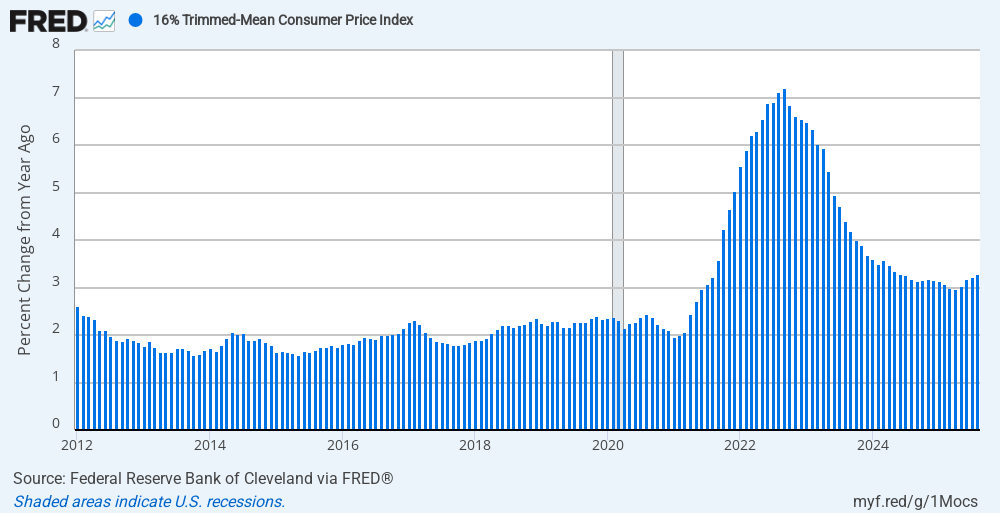
That was a drastic error from the get-go, but the money-printing gospel is of such convenience to both ends of the Acela Corridor that this cardinal pro-inflation error rolls forward unquestioned by both wings of the UniParty. Accordingly, with inflation stalled at more than 3.0%, when it should be zero or negative, the Fed again today sung the Einstein Chorus. That is to say, these “insane” apparatchiks seem to believe that doing the same thing over and over again—even after 700% inflation—will finally generate a positive outcome.
It won’t.
Y/Y Change In 16% Trimmed Mean CPI, 2012 to 2025
Reprinted with permission from David Stockman’s Contra Corner.


