
When it comes to the Donald’s Big Beautiful Bill there is one place, and one place alone, to start the discussion. We are referring, of course, to the built-in baseline of revenues, outlays and deficits under current Federal law and policy.
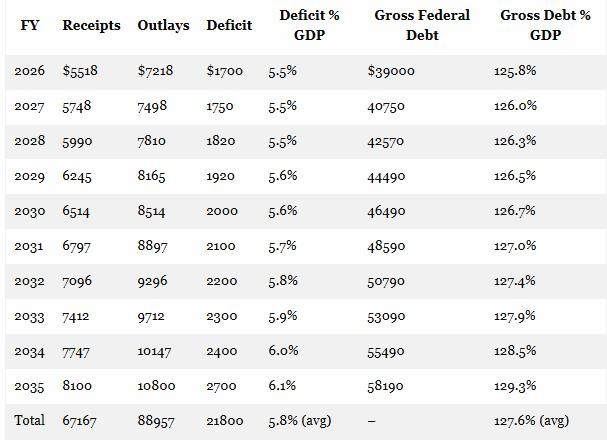
Needless to say, the latest CBO baseline amounts to a five-alarm dumpster fire. If Congress does nothing about entitlements, tax law or current funding policy for defense and nondefense discretionary programs, the annual Federal deficit will reach nearly $3 trillion and 6.1% of GDP by the end of the 10-year budget window. Accordingly, total public debt will soar from today’s $37 trillion to more than $58 trillion by 2035.
After that, it would be all over except the shouting because a combination of rising bond yields and soaring public debt would cause Uncle Sam’s interest expense to explode. Subsequently, the already massive structural deficit would easily double, thereby pushing the Federal debt level to a staggering $150 trillion by mid-century. Of course, we would likely never actually get that far because the financial markets would collapse long before 2050.
Given this cataclysmic outlook, you would think that slashing the deficit and braking the relentless growth of the public debt would be at the heart of the GOP fiscal plan. After all, it took the first 230 years of the American republic and 45 presidents to generate $21.8 trillion of public debt. Now, however, that figure would be duplicated again in the next 10-years unless Washington pivots hard toward fiscal austerity.
Alas, baseline deficit reduction is not even on the GOP’s agenda! That’s right. For the full ten year period they have not and will not table a single dime of net deficit reduction in crafting their Reconciliation Bill. And that’s actually pretty sick, given that the “reconciliation” mechanism was originally enabled in the 1974 budget reform act as a tool to facilitate fiscal control.
Instead, the GOP legislators are arguing about how much to INCREASE the already massive flow of red ink shown in the table below. In the fiscal scheme of things, the Donald’s Big Beautiful Bill is surely the most wanton act of fiscal perfidy ever committed on the banks of the Potomac.
Table: CBO Baseline Projections for FY 2026–2035 (billions)
Actually, the table above is barely the half of it. What is also embedded in the annual flow of these Federal budget numbers is the great big stinky trick the Trumpified GOP pulled the last time around in 2017. To wit, they embedded a huge $4 trillion “fiscal cliff” in the budget numbers beginning in FY 2026, owing to the expiration in 2025 of their ballyhooed TCJA tax cut of December 2017.
What this means, therefore, is that even the massive baseline deficit numbers shown in the table above assume a huge Federal tax increase commencing in 2026.
Accordingly, just to maintain the current individual income tax burden by extending the TCJA for a decade would add another $4 trillion to the baseline deficit even before you add higher debt service on the reduced revenue. And given that the GOP legislators devoutly desire to keep current tax rates, credits and deductions in place, they have actually started with a true baseline of upwards of $63 trillion of public debt by the end of the budget window.
And yet and yet. They are struggling to come up with even $1.5 trillion of budget cuts over the next decade, and virtually all of those cuts have been re-allocated to spending increases for defense, border control and other priorities—with hardly a net dime left for deficit reduction.
So, yes, the House bills show potential 10-year savings of $700 billion from Medicaid, $200 billion from Food Stamps, $300 billion from education and student loans and $200 billion from the delayed phaseout of the Biden green energy boondoggle tax credits. But those savings could be easily swallowed up over time by the $100 billion per year increase in the defense budget already tabled in the Trump “skinny budget” for FY 2026 alone and partially approved by the House Armed Services Committee. Also, there are tens of billions of additional increases annually for border control, veterans, air traffic control and other domestic priorities, which are virtually certain to become permanent, thereby eating up hundreds of billions of the above savings over the full ten-year budget period.
Indeed, the House markups to date are so full of budget gimmicks and scams, such as termination of many of the new tax cuts after 2028, that the Reconciliation bill’s net savings are likely to end up close to zero for one simple reason: The Trumpified GOP doesn’t give a good goddamn about fiscal control or the soaring public debt.
So to state the sheer criminal negligence of the matter: Faced with a fiscal dumpster fire, the Trumpified GOP looked $89 trillion of baseline spending for FY 2026-2035 squarely in the face and came up with a great big goose egg in terms of net savings.
It doesn’t get more perfidious than that. At the end of the day, the GOP rank and file know this bill is a Big, Ugly Debt Bomb, but they are so bamboozled by the fiscal miscreant in the Oval Office that they have thrown every bit of fiscal sobriety to the winds.
The truth is, unless they implant another fiscal cliff after FY 2035 by having the so-called Trump tax cut expire again, the honest longer-run impact of permanently extending the TCJA would be truly catastrophic: It would add an incremental 1% of GDP to the public debt each and every year, as far as the eye can see.
In short, the present policy of the Trumpified GOP is to guarantee that the bond pits will suffer a catastrophic breakdown long before 2050, meaning that smart investors will see it coming and begin to sell their US Treasury debt or even short it in order to get out of harms’ way. And once the selling starts in the bond pits, it will fuel a financial avalanche and collapse which will be unstoppable, even by the mighty printing presses of the Federal Reserve.
Federal Revenue Impact Of Extending the Expiring Provisions of the 2017 TCJA Thru 2035 (billions)
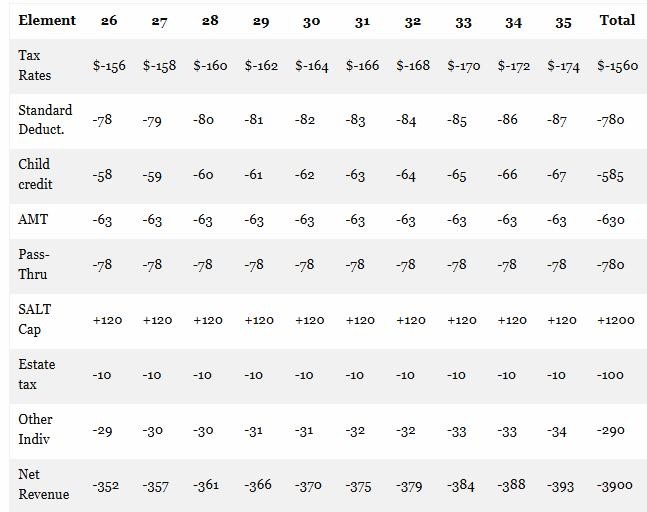
Despite all of this bad news, however, even the additional red ink displayed in the above table doesn’t tell the whole story. That’s because the real cost of TCJA extension for another ten years would be $1.2 trillion higher if the $10,000 per joint return cap on deductions for state and local taxes (SALT cap) is not also extended. Failure to re-up the SALT cap, in turn, would bring the total cost of extending the TCJA to $5.1 trillion over the decades ahead.
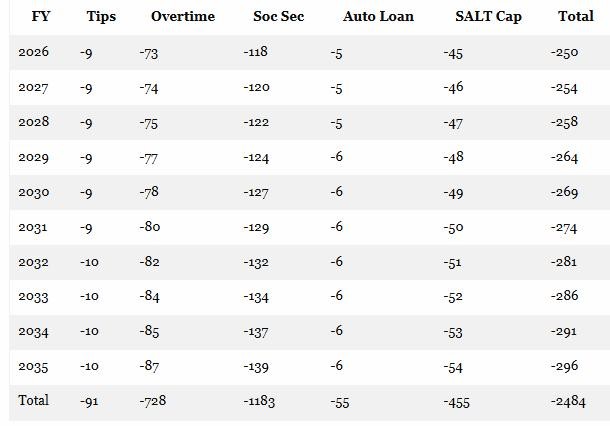
As it happens, Republicans cannot pass a Reconciliation bill without a drastic increase in the SALT cap because GOP Congressmen from high-tax blue states have drawn a firm line in the sand and they have more than enough votes to enforce it. So the Republican SALT caucus is demanding the cap be increased to $120,000 for joint returns, but even an eventual compromise at say $50,000 would reduce the revenue offset by $455 billion over the the decade, as shown in the table below.
Moreover, the GOP is also determined to enact the Trump campaign pledges to eliminate taxes on tips, overtime and Social Security, as well as make $10,000 of auto loan interest deductible. As shown below, those measures would add another $2.484 trillion in revenue loss over the decade. Yet at this point, this entire flood of additional red ink has been included in the GOP Reconciliation bill but is being hidden by an outright budget scam: To wit, most of the new tax cuts emanating from the Trump campaign pledge are written to expire after 2028.
Yes, indeed, in the presidential election year of 2028 we can hardly imagine a candidate from either party who would not be loudly advocating an extension of these provisions. In fact, that’s the very same kind of fiscal cliff that is embedded in the 2025 expiration of the TCJA.
10-Year Cost Of Additional GOP Revenue Measures (billions of $)
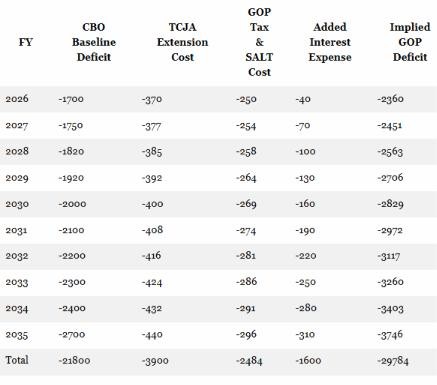
So, when you add it all up you get a pretty dire picture. The GOP started its mark-up process facing a $22 trillion baseline deficit over the next decade, but at this point the bill grinding out of the legislative sausage factory is bordering on adding $30 trillion. That is, damn near doubling the catastrophic $37 trillion of public debt already on the books.
Still, Donald Trump has the crazy-ass delusion that he is leading the nation toward a renewed Golden Age of Capitalist prosperity. Nothing could be further from the truth because even the tepid GOP restraint on Federal spending and borrowing that has been present historically has now been totally obliterated.
The Trumpified GOP, in fact, is every bit as threatening to the economic well-being of main street America as the Big Spending Dems ever were. And they will not escape that ignominy unless they are able in the next few weeks to kill the Donald’s Big Beautiful Bill deader than a doornail!
The Trumpified GOP’s Plan To Add $30 Trillion To The Public Debt (billions of $)
Of course, the Trumpian fanboys and the small phalanx of knee-jerk Republican economists will say not to worry because, well, “growth”. That is, the Donald’s Dog’s Breakfast of inflationary tariffs, inflationary labor supply deportations and interest rate-increasing Federal deficits will supposedly cause the economic growth rate to accelerate, thereby generating higher taxable incomes, increased revenues and reduced Federal deficits.
Except. Except.”Growing” your way out of fiscal policy deficits has been a bogus theory ever since the Lafferites invented it in the early 1980s and even bamboozled the Gipper with its endless repetition. In truth, this hoary claim is both wrong in theory and has never been even remotely proven in practice.
There is one powerful core reason for this inconvenient truth: To wit, Federal revenues are driven by nominal GDP, not so-called real GDP. To be sure, the tax brackets are indexed to prevent bracket creep, but when wages go up by 4% owing to 2% inflation and 2% real gains, taxable income is 4% higher. And if the mix is 4% real growth and 0% inflation, taxable income is still just 4% higher.
Indeed, the whole theory of tax cuts is that lower rates will increase the supply of labor hours offered in the market, as well as the supply of other factors of production such as productivity fostering capital investment. These additional supply-side resources, in turn, would tend to reduce costs and inflationary pressures.
That is to say, all thing equal supply side tax cuts will help improve the mix between the inflation component and the real component of nominal GDP. But as far as the US Treasury is concerned, it is nominal income that is reported on 1040s and nominal revenues that are collected in withholding tax payments.
So the question recurs. Is there any reason to assume that the tax provisions of the GOP reconciliation bill—along with the rest of the Trump agenda including tariffs and regulatory rollbacks—will cause nominal GDP, as opposed to real GDP, to be higher over the next decade than assumed in the CBO baseline.
As shown below, the CBO baseline which projects $22 trillion of deficits over the next decade assumes that nominal GDP will grow at a 4.20% compound rate, generating a total of $371.5 trillion of nominal GDP over the period. In turn, baseline revenue under current law of $67.167 trillion amounts to 18.1% of nominal GDP.
As it happens, the growth rate of nominal GDP between Q4 2007 and Q1 2025 was, well, exactly 4.21% per annum. And that was during a period in which there was massive monetary expansion and stimulus.
To wit, between Q4 2007 and Q1 2025, Federal Reserve credit outstanding—or what is otherwise described as high powered money—rose at the staggering rate of 12.5% per annum. And, folks, we do not believe there is a snowballs’ chance in the hot place that the Eccles Building will be in a position to run the Fed’s printing presses at anything close to that red hot rate during the decade ahead.
Obviously, that certainty is owing to the fact that the Fed finally let the inflation genie out of the bottle, and is now in a rearguard struggle to bring it down to even close to its supposedly sacrosanct 2.00% target. So we believe the Fed’s printing presses will stay close to idle for many years to come, yet without inflationary stimulus from the Fed there is absolutely no reason to believe that nominal GDP growth rate will accelerate. Indeed, if the US economy generates even the 4.2% nominal growth CAGR embodied in the CBO baseline, it will be something of an economic miracle.
So under no circumstances is it reasonable to assume more than $371.2 trillion of nominal GDP will materialize over the next decade. Art Laffer’s napkin to the contrary notwithstanding, therefore, there is no way that Federal revenue even under current law would come in higher than the $67 trillion already in the CBO baseline for FY 2026-2035. Under the circumstances, in fact, the CBO baseline already amounts to Rosy Scenario Redux.
CBO Baseline Assumptions For Nominal GDP, Real GDP, Interest Rates and CPI, FY 2026-2035
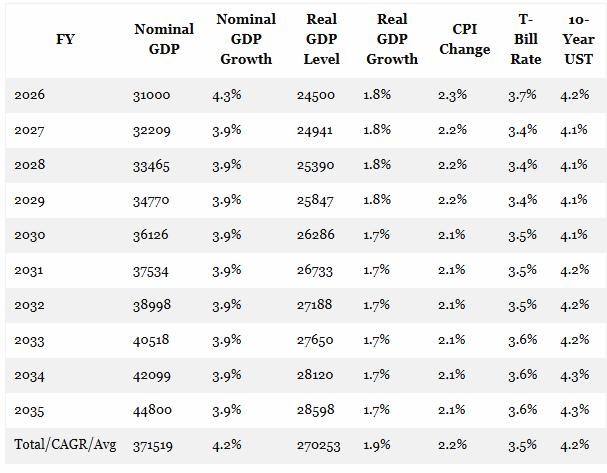
To be sure, it is possible that the implicit mix of inflation and growth will vary from the CBO assumptions, which peg real GDP growth at 1.9% per annum and the implicit GDP deflator at 2.3% in alignment with the CPI assumption shown in the table above. But even a shift to say real growth of 2.9% and inflation to 1.3% per annum won’t make a dimes worth of difference in the budget numbers owing to what might be termed the second Inconvenient Truth about economic growth and budget impact.
The idea that higher economic growth is significantly favorable to the budget is essentially an obsolete Keynesian axiom reflective of a time when the US economy was driven by Workfare, as opposed to today’s overwhelming dominance by Welfare. Under the older Keynesian formulation, an economy operating at well less than full employment would generate a surge in unemployment insurance (UI) payments, which, in turn, would balloon the deficit. And that was supposedly a good thing because unemployment payments would cushion the fall of wage-based consumption spending, thereby braking the recessionary contraction; and then such counter-cycle UI outlays would automatically shrink as the economy recovered.
Whatever the once-upon-a-time merits of this counter-cyclical budget model, it is surely vestigial today. The CBO baseline spending for FY 2026, for instance, includes $4.2mtrillion of outlays for Welfare State programs including Social Security, Medicare, Medicaid, Veterans Benefits and food stamps versus just $38 billion for unemployment insurance. UI spending is thus a mere 0.9% of the Welfare State budget, which is almost entirely insensitive to the state of the macro-economy.
Accordingly, even a tripling of unemployment insurance spending owing to weaker than forecast real growth and employment would hardly make a ripple in Federal spending and deficits. On the other hand, of course, higher real growth than the 1.9% per annum rate assumed in the CBO baseline would not make a damn bit of difference to Federal spending, either.
In the first place, higher growth is largely irrelevant to the giant Welfare State budget–none of these 145 million people work or have jobs to loose anyway. At the same time, the CBO forecast assumes virtual full-employment for the entire period, meaning that the de minimis $38 billion projected for Unemployment Insurance outlays in FY 2026 and the years beyond is driven overwhelmingly by on-going “frictional” unemployment that is present even in a so-called full-employment economy. An even stronger economy than CBO optimistically assumes, therefore, wouldn’t reduce the cyclical component of UI spending because the baseline assumption already presumes full employment.
In short, high real growth owing to supply side tax cuts under today’s factual circumstances is likely to neither boost revenue collections materially nor reduce spending levels by measureable amounts relative to the CBO baseline. Accordingly, there is no revenue reflow or so-called dynamic effect of modestly higher economic growth rates on the budget outcomes.
The current catastrophic path of the Federal budget, therefore, can only be addressed by politically painful decisions to slash spending including entitlements and defense or force the people to pay higher taxes for the bloated level of government spending that no one wants to meaningfully challenge.
Nor are we talking pure theory and economic logic. The proof is actually in the pudding from the 2017 Trump tax cut itself. Owing to the immense cumulative distortions in the US economy owing to decades of money-printing and cheap debt, the Trump tax cut—even on the business side—got mostly captured by Wall Street speculators rather than fueling main street growth.
At the time of enactment in December 2017, net business investment in the US economy was already at an all-time low of just under 3.0% of GDP. As is evident from the graph, investment levels relative to the size of the economy actually continued to shrink, notwithstanding cutting the corporate tax rate from 35% to 21% and supplying an additional $100 billion per year of incentives for CapEx by unincorporated businesses via the 20% investment deduction.
Business CapEx (nonresidential fixed investment) As % Of GDP, 1971 to 2023

The question arises, of course, as to where all the increased corporate cash flow from the sharp reduction in businesses taxes actually ended up. But, alas, the latter is no mystery. The money-printing policies of the Fed over the nearly four decades since Alan Greenspan took the helm at the Fed have turned Wall Street into a veritable casino, where gamblers reward the C-suites of America for financial engineering maneuvers like stock buybacks, leveraged recaps and outright LBOs rather than productive investment in plant, equipment and technology on main street.
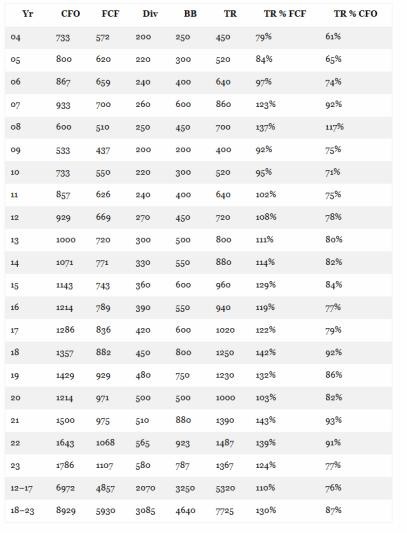
Consequently, operating cash flows of the S&P 500, for instance, rose from $6.972 trillion during the six year period before the 2017 tax cut (2012-2017) to $8.929 trillion during the six year afterwards (2018 through 2023) or by +28%. At the same time, dividends rose by +49% and stock buybacks by +42% as between the two periods.
In total dollars, the gain of $1.957 trillion of operating cash flow during 2018 through 2023 compared to the prior six-year period was offset by an increase of $2.407 trillion in returns to shareholders. Stated differently, 123% of the corporate tax cut-assisted gain in operating cash flows of the S&P 500 companies ended up being flushed back through Wall Street in the form of dividends and stock buybacks!
Indeed, with 87% of operating cash flows being devoted to dividends and stock buybacks during 2018-2023, there was only $1.161 trillion left for net investment on main street. That compared to the 76% shareholder return ratio during the six years before the Trump tax cut, which had left $1.673 trillion for net investment on main street.
That’s right. The availability of cash flows for net investment on main street declined by 31% during the six years after the 2017 tax cut. What this indicates, of course, is that all things are not equal. The rampant money-printing of the Fed has so corrupted Wall Street that even supply-side tax cuts have been diverted into increased levels of rent-seeking speculation and financial engineering.
S&P 500: Aggregate Cash From Operations, Free Cash Flow, Dividends, Stock Buybacks And Total Returns To Shareholders, 2004 to 2023.
For want of doubt, here are two additional measures of economic performance for the seven-years before and after the 2017 tax cuts. In the case of real economic growth, as measured by real final sales, the annualized gain deteriorated sharply during the post-tax cut period, falling from 2.56% per annum during the five years ending in Q4 2017 to 2.27% per annum in the period since then.
In the case of real wage and salary income, the comparison is even more negative. The growth rate of real wages has deteriorated by nearly one-fifth since 2017.
Per Annum Inflation-Adjusted Growth In Wage and Salary Incomes:
- 2010-2017: 2.43%.
- 2017-2024: 1.92%.
At the end of the say, there is no if, ands or buts about it. The Trumpified GOP is fixing to serve up a veritable Debt Bomb, and there is no case whatsoever that the US economy can grow its way out of the $30 trillion of new debt the Donald’s Big Beautiful Bill is about to dump upon the already debt-entombed main street economy.
Reprinted with permission from David Stockton’s Contra Corner.


