
The best country in the world is the one you live in.
Or… not?
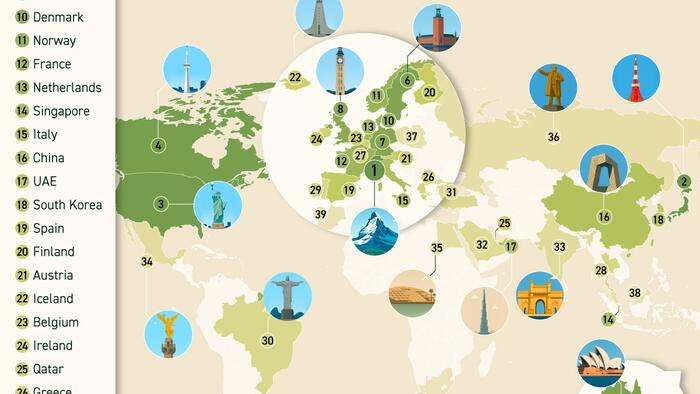
This infographic, via Visual Capitalist’s Pallavi Rao, spotlights the 40 countries that the world perceives to be the “best.”
Like most efforts to quantify a qualitative measure, this ranking reflects public perceptions, not hard data. However, countries did have to meet certain GDP, tourism, and FDI thresholds to be included in the race.

Data for this infographic is sourced from U.S. News & World Report in partnership with Wharton and WPP. They asked more than 17,000 people to judge 87 nations across 73 attributes grouped in 10 subrankings.
ℹ️ Their survey was conducted between March 22nd–May 23rd, 2024.
Skip to the last section to read the full methodology breakdown, or visit the source’s explanation page here.
This Small European Country is the Best in the World
From its snow-capped peaks to its powerhouse financial sector, Switzerland has secured the public’s vote as the world’s best country in 2024.
| Rank | Country | Region |
|---|---|---|
| 1 | 🇨🇭 Switzerland | Western Europe |
| 2 | 🇯🇵 Japan | Eastern Asia |
| 3 | 🇺🇸 U.S. | Northern America |
| 4 | 🇨🇦 Canada | Northern America |
| 5 | 🇦🇺 Australia | Oceania |
| 6 | 🇸🇪 Sweden | Northern Europe |
| 7 | 🇩🇪 Germany | Western Europe |
| 8 | 🇬🇧 UK | Northern Europe |
| 9 | 🇳🇿 New Zealand | Oceania |
| 10 | 🇩🇰 Denmark | Northern Europe |
| 11 | 🇳🇴 Norway | Northern Europe |
| 12 | 🇫🇷 France | Western Europe |
| 13 | 🇳🇱 Netherlands | Western Europe |
| 14 | 🇸🇬 Singapore | South-Eastern Asia |
| 15 | 🇮🇹 Italy | Southern Europe |
| 16 | 🇨🇳 China | Eastern Asia |
| 17 | 🇦🇪 UAE | Western Asia |
| 18 | 🇰🇷 South Korea | Eastern Asia |
| 19 | 🇪🇸 Spain | Southern Europe |
| 20 | 🇫🇮 Finland | Northern Europe |
| 21 | 🇦🇹 Austria | Western Europe |
| 22 | 🇮🇸 Iceland | Northern Europe |
| 23 | 🇧🇪 Belgium | Western Europe |
| 24 | 🇮🇪 Ireland | Northern Europe |
| 25 | 🇶🇦 Qatar | Western Asia |
| 26 | 🇬🇷 Greece | Southern Europe |
| 27 | 🇱🇺 Luxembourg | Western Europe |
| 28 | 🇹🇭 Thailand | South-Eastern Asia |
| 29 | 🇵🇹 Portugal | Southern Europe |
| 30 | 🇧🇷 Brazil | South America |
| 31 | 🇹🇷 Turkey | Western Asia |
| 32 | 🇸🇦 Saudi Arabia | Western Asia |
| 33 | 🇮🇳 India | Southern Asia |
| 34 | 🇲🇽 Mexico | Central America |
| 35 | 🇪🇬 Egypt | Northern Africa |
| 36 | 🇷🇺 Russia | Eastern Europe |
| 37 | 🇵🇱 Poland | Eastern Europe |
| 38 | 🇲🇾 Malaysia | South-Eastern Asia |
| 39 | 🇲🇦 Morocco | Northern Africa |
| 40 | 🇿🇦 South Africa | Southern Africa |
Survey respondents ranked Switzerland highly for business (#2), quality of life (#3), social purpose (#7) and cultural influence (#8).
For the hard data enthusiasts, Switzerland ranks third by GDP per capita, ($105,000), boosted by its enormous banking sector known for its secrecy.
It’s fourth by GNI per capita ($95,070), which removes the effects of outside financial flows entering the country.
Economic Might Still Matters
However, Japan (#2) and the U.S. (#3) remain fixtures near the top thanks to their outsized GDPs, deep innovation pipelines and global brands.
Business friendliness weighed heavily: they’re top five for entrepreneurship, while the U.S. ranks #1 for agility and power.
Meanwhile, high investor confidence and strong currency reserves help each nation offset middling scores on cost of living and income equality.
Together they illustrate how sheer economic heft continues to sway public perception—even in an era generally more focused on sustainability and social values.
Middle East and Asia Make Inroads in Global Perceptions
The UAE (#17), Qatar (#25) and Saudi Arabia (#32) showcase the Middle East’s growing soft-power ambitions.
Targeted investment in tourism, green energy, and cultural projects burnishes their brand beyond the somewhat disparaging “petro-state” label.
Likewise, South Korea (#18), Singapore (#14) and China (#16) leverage advanced manufacturing and technological prowess to climb the ranking.
Their rise hints at a more multipolar world where Western dominance over “best country” narratives is steadily eroding.
Determining the “Best Countries” in the World
U.S. News designed its “Best Countries” ranking around 73 attributes grouped into 10 thematic subrankings, such as quality of life, power, and entrepreneurship.
To reiterate, these rankings reflect public perceptions, not hard data. To gather this, the survey is distributed globally to about 17,000 respondents, including business leaders, informed elites, and general citizens.
Each participant is shown a random subset of countries (that must meet GDP, tourism, and FDI thresholds) and asked to rate how strongly they associate those countries with each of the 73 attributes.
These individual attributes are pre-assigned to categories by researchers, and scores are normalized on a 0–100 scale. Category scores are then averaged for each country.
Finally, respondents also rank how important each category is to them. These rankings determine the weights assigned to each category.
A country’s final score is calculated by combining its weighted category scores, producing the overall rankings seen in this graphic.
If you enjoyed today’s post, check out The World’s Richest Countries Across Three Metrics on Voronoi, the new app from Visual Capitalist.
Loading…


