Authored by Lance Roberts via RealInvestmentAdvice.com,
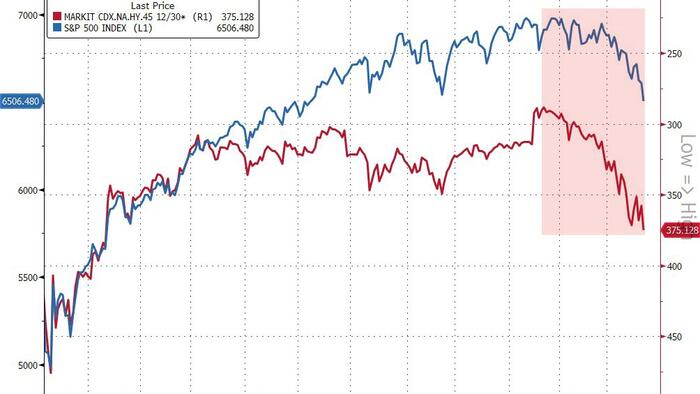
Most investors spend their time watching the S&P 500. That’s a mistake, because the credit market is the real “tell.” The bond market has been whispering a warning for weeks now, and credit spreads are now shouting it. As of this writing, the CDX Index, a benchmark measure of credit default swap spreads, has climbed to a nine-month high while the S&P 500 sits within 5% of its all-time peak. Over the past 20 years, every time that combination appeared, a bear market followed. Every single time.
That’s a track record worth taking seriously, and credit spreads are critical to understanding market sentiment and predicting potential stock market downturns. A credit spread refers to the difference in yield between two bonds of similar maturity but different credit quality. This comparison often involves Treasury bonds (considered risk-free) and corporate bonds (which carry default risk). By observing these spreads, investors can gauge risk appetite in financial markets. Such helps investors identify stress points that often precede stock market corrections.
The chart shows the annual rate of change in the S&P 500 market index versus the yield spread between Moody’s Baa corporate bond index (investment grade) and the 10-year US Treasury Bond yield. Rising yield spreads consistently coincide with lower annual returns in the financial markets.

The reason is that credit is the lifeblood of the economy. Businesses borrow to operate, and consumers borrow to spend. As such, when the cost of that borrowing rises, particularly the premium lenders demand to extend credit to riskier borrowers, it signals that the economy is under stress. That “stress” directly affects forward earnings estimates and increases the likelihood of a valuation repricing.
The “Junk to Treasury” spread is the clearest expression of this dynamic. Investors who buy high-yield bonds, the ones with a meaningful chance of default, should demand a premium above the risk-free rate offered by U.S. Treasury bonds. When that premium compresses, it signals that investors are comfortable speculating, willing to reach for yield without demanding adequate compensation for the risk they’re accepting. When the premium expands, the mood has shifted. Lenders are getting nervous. Credit conditions are tightening. And historically, tighter credit conditions have preceded more challenging environments for stocks.

This isn’t a theoretical relationship; it has repeatedly appeared in the data for decades. The bond market (CDX) prices risk continuously across thousands of issuers and maturities. It’s harder to talk up than equities, and it’s not susceptible to the same retail-driven momentum that can keep stock prices elevated long after the fundamental picture has deteriorated.

When credit spreads widen, investors should pay attention.
What The CDX Is Telling Us Now.
The chart from Sentiment Trader below tells the story as clearly as any amount of prose could. The top panel tracks the S&P 500 since 2007. The middle panel shows the CDX Index of credit default swaps. The bottom panel shows where those spreads stand relative to their 189-bar range, essentially a percentile reading of how elevated they are relative to recent history. (Red markers indicate instances where CDX spreads hit 9-month highs while the S&P 500 is within 5% of its high.)

Notice that each red arrow marks a moment when CDX spreads reached a nine-month high while stocks remained near their all-time highs. The 2007 signal preceded the worst financial crisis since the Great Depression. The 2015 signal preceded a sharp correction and an extended period of volatility. The 2022 signal arrived just before the Federal Reserve’s aggressive rate-hiking campaign drove the S&P 500 down 25%. And now, in early 2026, the signal has triggered again.
“This has been one of the more important divergences we’ve been tracking recently. CDS is pushing to a 9-month high even with equities near highs, effectively tightening financial conditions. Historically, this setup has been unstable: about half the time it led to sharp drawdowns, while the rest saw either mild pullbacks or continued gains.” – Sentiment Trader
The range-rank reading in the bottom panel is particularly instructive. It shows that current CDX spread levels are not a minor blip, but are registering near the upper end of their recent historical range. That’s not statistical noise, but a market pricing in genuine credit stress. The table below summarizes the four instances over the past two decades where CDX spreads hit nine-month highs while the S&P 500 traded within 5% of its peak. The subsequent market outcomes speak for themselves.

Does this mean the current situation will devolve into a bear market? Not necessarily, but history suggests the risk is elevated enough to warrant investors’ attention. It is also worth noting that the magnitude of the subsequent declines varied considerably, from the catastrophic 2008 to 2009 bear market to the more contained 2015 correction. That is due to the severity of the credit impact on the underlying economy. However, they all shared a period of elevated credit spreads that the equity market initially chose to ignore.
So far, this “time is not different.”
The Counterargument Is Not Convincing
The bulls will argue that CDX spreads are widening from historically tight levels and that the absolute level of stress remains modest by historical standards. That’s technically accurate, as shown, Treasury-to-Junk Bond spreads in early 2026 are not at the panic levels seen in 2008 or 2020. So why worry?

It isn’t the absolute level of the CDX that matters, but the direction of travel and the rate of change. If investors wait for the “spike,” it will likely be too late to act. Sentiment Trader’s nine-month high threshold isn’t about measuring the peak of a crisis; it is a warning of a potential turn. Credit stress doesn’t arrive fully formed. It builds. Each of the prior signals triggered before the real damage was done, precisely because spreads were starting to move, not because they had already maxed out.

There’s also the macro backdrop to consider. The S&P 500 enters this period with valuations near the upper end of its historical range, forward earnings estimates elevated, and sentiment still bullish. As investors, we monitor the high-yield spread closely because it is often one of the earliest signals of a fundamental shift in corporate and economic conditions. In other words, watching spreads provides insights into the health of the corporate sector, which is a major driver of equity performance. When CDX spreads widen, they often lead to lower corporate earnings, economic contraction, and stock market downturns. The reason is that a significant widening of the CDX spreads signal:
-
Liquidity Drain: As investors become more risk-averse, they shift capital from corporate bonds to safer assets, such as Treasuries. The flight to safety reduces liquidity in the corporate bond market. Lower liquidity can lead to tighter credit conditions, affecting businesses’ ability to invest and grow and weighing on stock prices.
-
Corporate Financial Health: Credit spreads reflect investor views on corporate solvency. A rising spread suggests a growing concern over companies’ ability to service their debt. Particularly if the economy slows or interest rates rise.
-
Risk Sentiment Shift: Credit markets are more sensitive to economic shocks than equity markets. When CDX spreads widen, it typically indicates that the fixed-income market is pricing in higher risks. This is often a leading indicator of equity market stress.
-
Corporate earnings may decline: Companies with lower credit ratings may struggle to refinance debt at favorable rates, thereby reducing profitability.
-
Economic growth is slowing: A widening CDX spread often reflects concerns that the economy is heading for a slowdown, which can lead to reduced consumer spending, lower business investment, and weaker job growth.
-
Stock market volatility may rise: As credit conditions tighten, investor risk appetite tends to decline, leading to higher volatility in equity markets.
Listening to credit spreads, particularly the high-yield spread versus Treasuries, is a critical indicator of stock market downturns. Historically, they have been a reliable early warning signal of recessions and bear markets.
Key Catalysts Next Week
The calendar downshifts after two consecutive weeks of high-impact data. No marquee releases are scheduled, but don’t mistake a thin calendar for a quiet tape. The dominant forces will be the market’s ongoing digestion of the March 18 FOMC decision, the updated dot plot, and Powell’s characterization of the stagflation dilemma—all compounded by quarter-end institutional flows that historically amplify moves in both directions.
By Monday, traders will have had a full weekend to digest whether the dots shifted to zero cuts (risk-off repricing in housing, small caps, and high-duration tech) or held at one with dovish language acknowledging labor deterioration (relief bid). A parade of Fed speakers throughout the week will provide color, walking back or reinforcing whatever Powell signaled. Those headlines will move markets more than any scheduled data.
Tuesday’s Q4 Productivity final revision matters more than usual. The prior quarter showed output rising 5.4% while hours worked grew just 0.5%. The unit labor cost component is the inflation signal: falling costs give the Fed room, rising costs tighten the stagflation case. Richmond Fed Manufacturing rounds out the regional factory picture alongside the Empire State and Philly Fed surveys.
Friday’s final UMich Consumer Sentiment is the week’s marquee event. The preliminary reading dropped to 55.5—near post-pandemic lows. The one-year and five-year inflation expectations are what the Fed watches most closely; a spike above 3% would validate the hawkish hold and kill remaining hopes for near-term easing.

Underneath the data, the real story is mechanical: Q1 ends March 31. Pension funds and institutional allocators begin quarter-end rebalancing and window dressing. After the sharp rotation out of tech and into value that defined the first quarter, the question is whether those flows reverse or accelerate. In a thin-catalyst week, flow-driven moves can be outsized.
Don’t mistake repositioning for conviction.